Saga Communications, Inc. (SGA)
Communication Services • Broadcasting • $8.4 • MCap: 52,898,460
https://www.sagacom.com • Saga Communications, Inc., a media company, acquires, develops, and operates broadcast properties in the United States. It owns and operates FM and AM radio stations, as well as metro signals. The company's radio stations employ various programming formats, including classic hits, country, classic country, hot/soft/urban adult contemporary, oldies, classic rock, rock, and news/talk. In addition, it engages in broadcast advertising; digital advertising across multiple platforms, such as targeted display advertising, search engine management, search engine optimization, online promotions, advertising on its online news sites and websites and digital audio streams, mobile messaging, email marketing, and other e-commerce; and concerts, promotional events, tower rental, and other miscellaneous activities. Saga Communications, Inc. was incorporated in 1986 and is headquartered in Grosse Pointe Farms, Michigan.
AAII
Ani
| Score | Price | 52 Week & Averages | Relative Strength | Risk | |||||
|---|---|---|---|---|---|---|---|---|---|
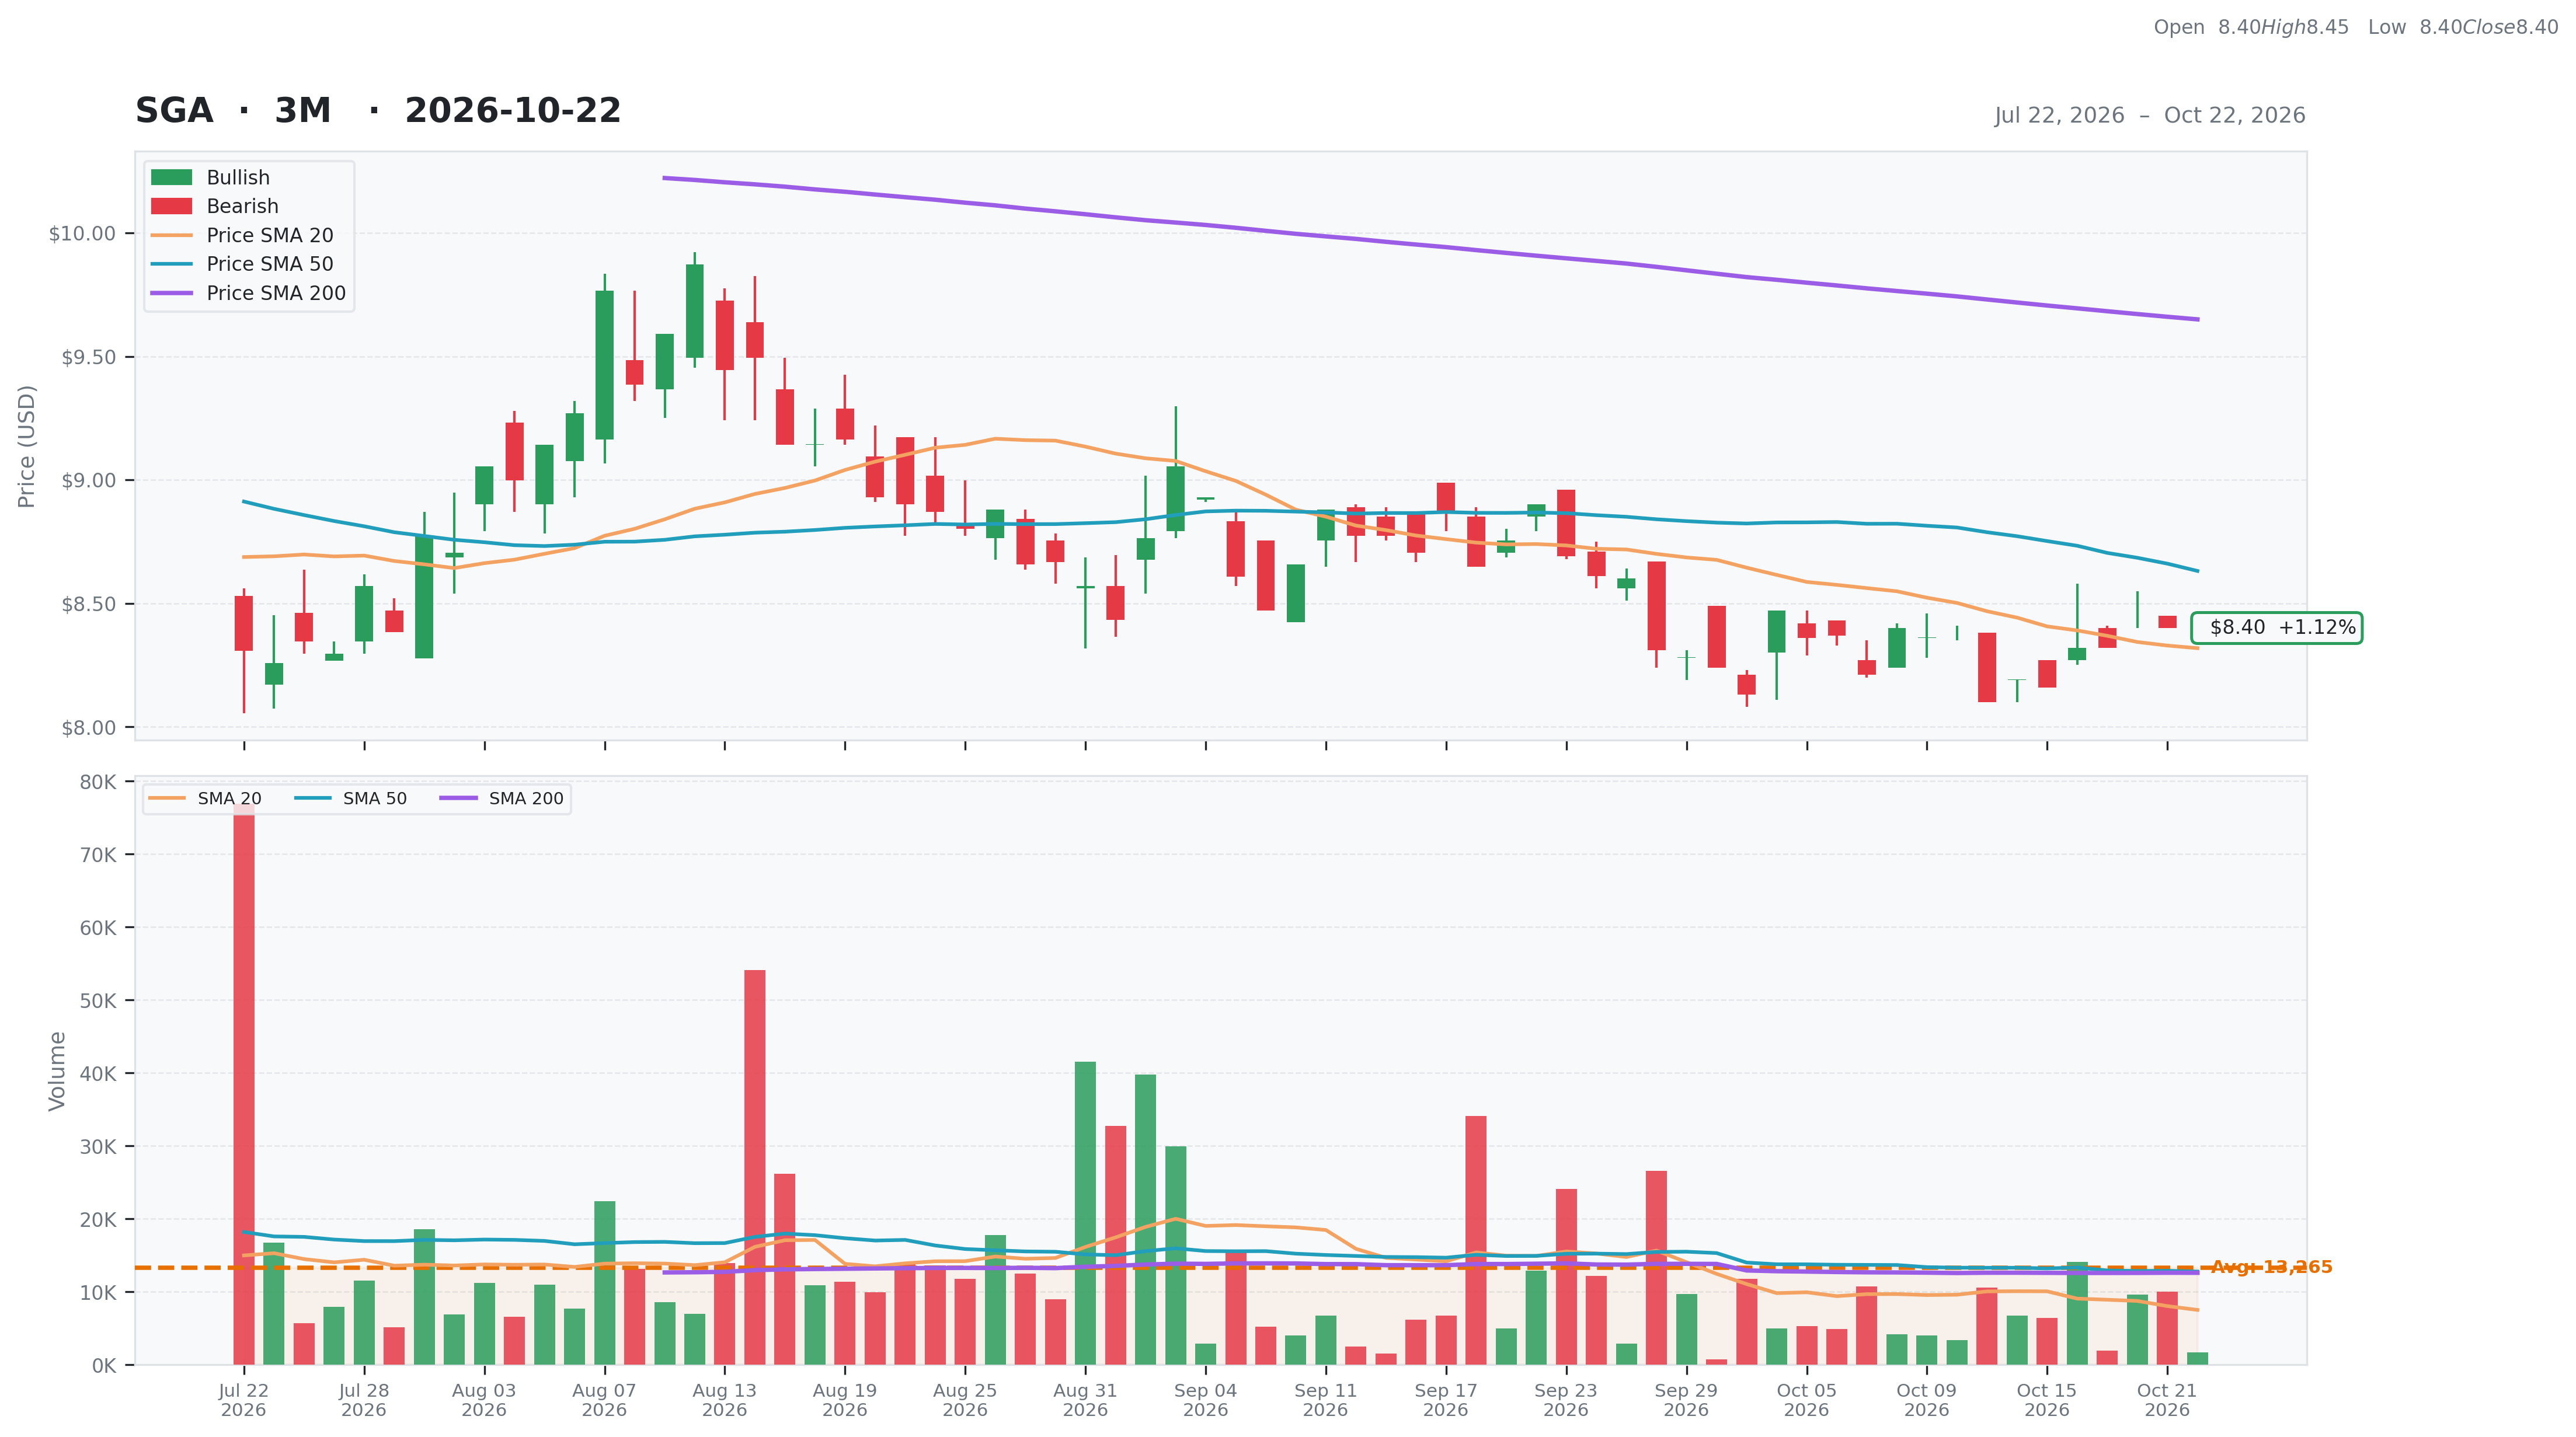
| Total | 31 | Current | $8.40 | 52W High | $11.85 -29.10% | Relative Strength | -0.14 | Beta | -0.07 |
| Business Quality | 1 | Weekly | $8.16 2.94% | 52W Low | $8.10 3.70% | 3M | 0.01 | Short % | 0 |
| Financial Strength | 12 | Monthly | $8.90 -5.62% | Above 50DMA | $8.63 -2.68% | 6M | -0.23 | Risk Score | |
| Growth Outlook | 0 | Quarterly | $8.35 0.65% | Above 200DMA | $9.65 -12.95% | 9M | -0.20 | ||
| Momentum | 2 | Yearly | $11.16 -24.70% | 12M | -0.26 | ||||
| Valuation | Financial Strength | Growth/Profitability | |||
|---|---|---|---|---|---|
| Trailing P/E | N/A | Cash | 28M | Revenue Growth | -0.06% |
| Forward P/E | 17.33 | Debt | 10M | Earnings Growth | -0.14% |
| PEG Ratio | 4.31 | Debt/Equity | 6.84 | Qtr Earnings Growth | -0.15% |
| Price/Sales | 0.51 | Current Ratio | 2.24 | Gross Margin | 0.12% |
| Price/Book | 0.36 | Quick Ratio | 2.04 | Operating Margin | -0.03% |
| EV/Revenue | 0.34 | Operating CF | 2M | Profit Margin | -0.09% |
| EV/EBITDA | -42.40 | Free CF | 2M | EBITDA Margin | -0.01% |
| Ent Value | 35M | Return on Assets | -0.02% | ||
| Return on Equity | -0.06% | ||||
| Technical | Volume & Bollinger Bands | Analyst | |||
|---|---|---|---|---|---|
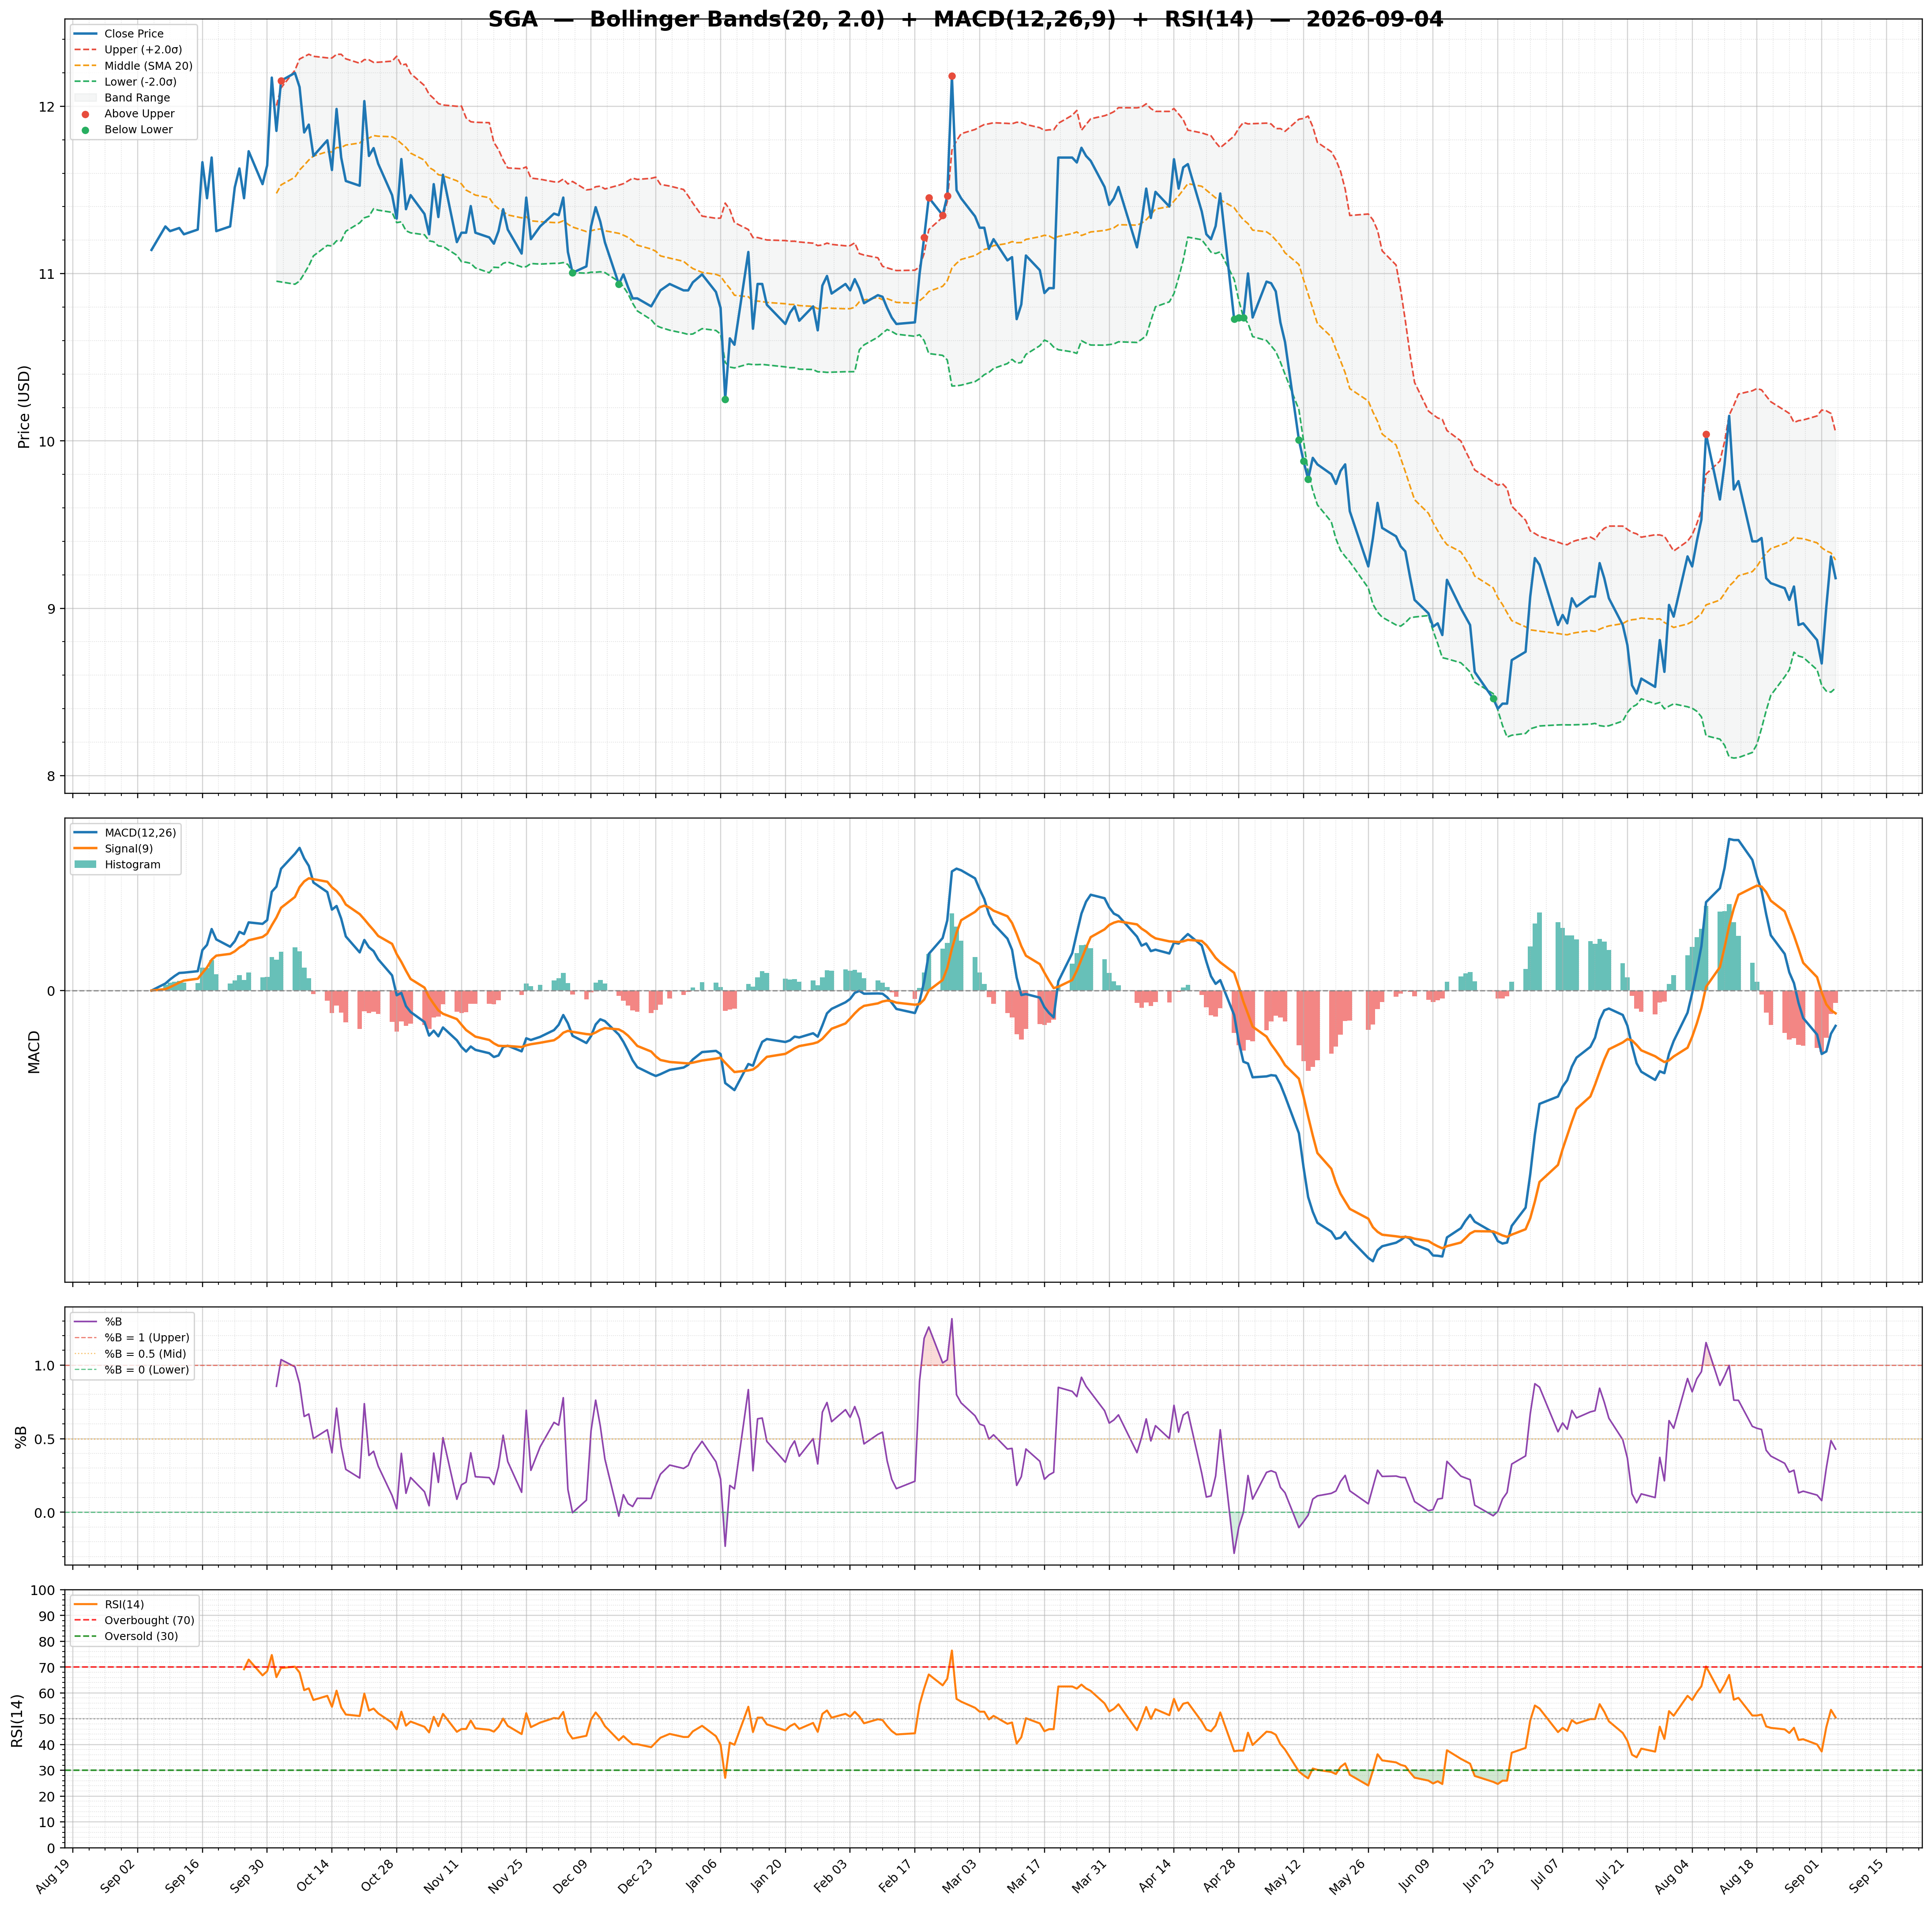
| RSI | 48.97 | Volume | 0.01M | Rating | none |
| Previous RSI | 48.97 | Avg Volume 20D | 0.01M | Target Mean | $14.00 |
| RSI Trend | Down | Relative Volume | 0.19 | Target High | $14.00 |
| MACD | -0.08 | Lower Band | 8.08 | Target Low | $14.00 |
| MACD Signal | -0.11 | Middle Band | 8.32 | Target Median | $14.00 |
| Histogram | 0.03 | Upper Band | 8.56 | Analysts | 1 |
| Previous Histogram | 0.03 | Bandwidth | 5.840 | Upside | 68.27% |
| Histogram Trend | Increasing | %B | 0.67 | ||