SIFCO Industries, Inc. (SIF)
Industrials • Aerospace & Defense • $20.17 • MCap:
https://sifco.com • SIFCO Industries, Inc., together with its subsidiaries, produces and sells forgings and machined components primarily for the aerospace and energy, and defense and commercial space markets in the United States and internationally. The company's processes and services include forging, heat-treating, chemical processing, and machining. It also offers original equipment manufacturer (OEM) and aftermarket components for aircraft and industrial gas turbine engines; steam turbine blades; structural airframe components; aircraft landing gear components; aircraft wheels and brakes; rotating components for helicopters; and commercial/industrial products. In addition, the company provides heat-treatment, surface-treatment, non-destructive testing, and select machining and sub-assembly of forged components. SIFCO Industries, Inc. was founded in 1913 and is headquartered in Cleveland, Ohio.
Ex-AAII
| Score | Price | 52 Week & Averages | Relative Strength | Risk | |||||
|---|---|---|---|---|---|---|---|---|---|
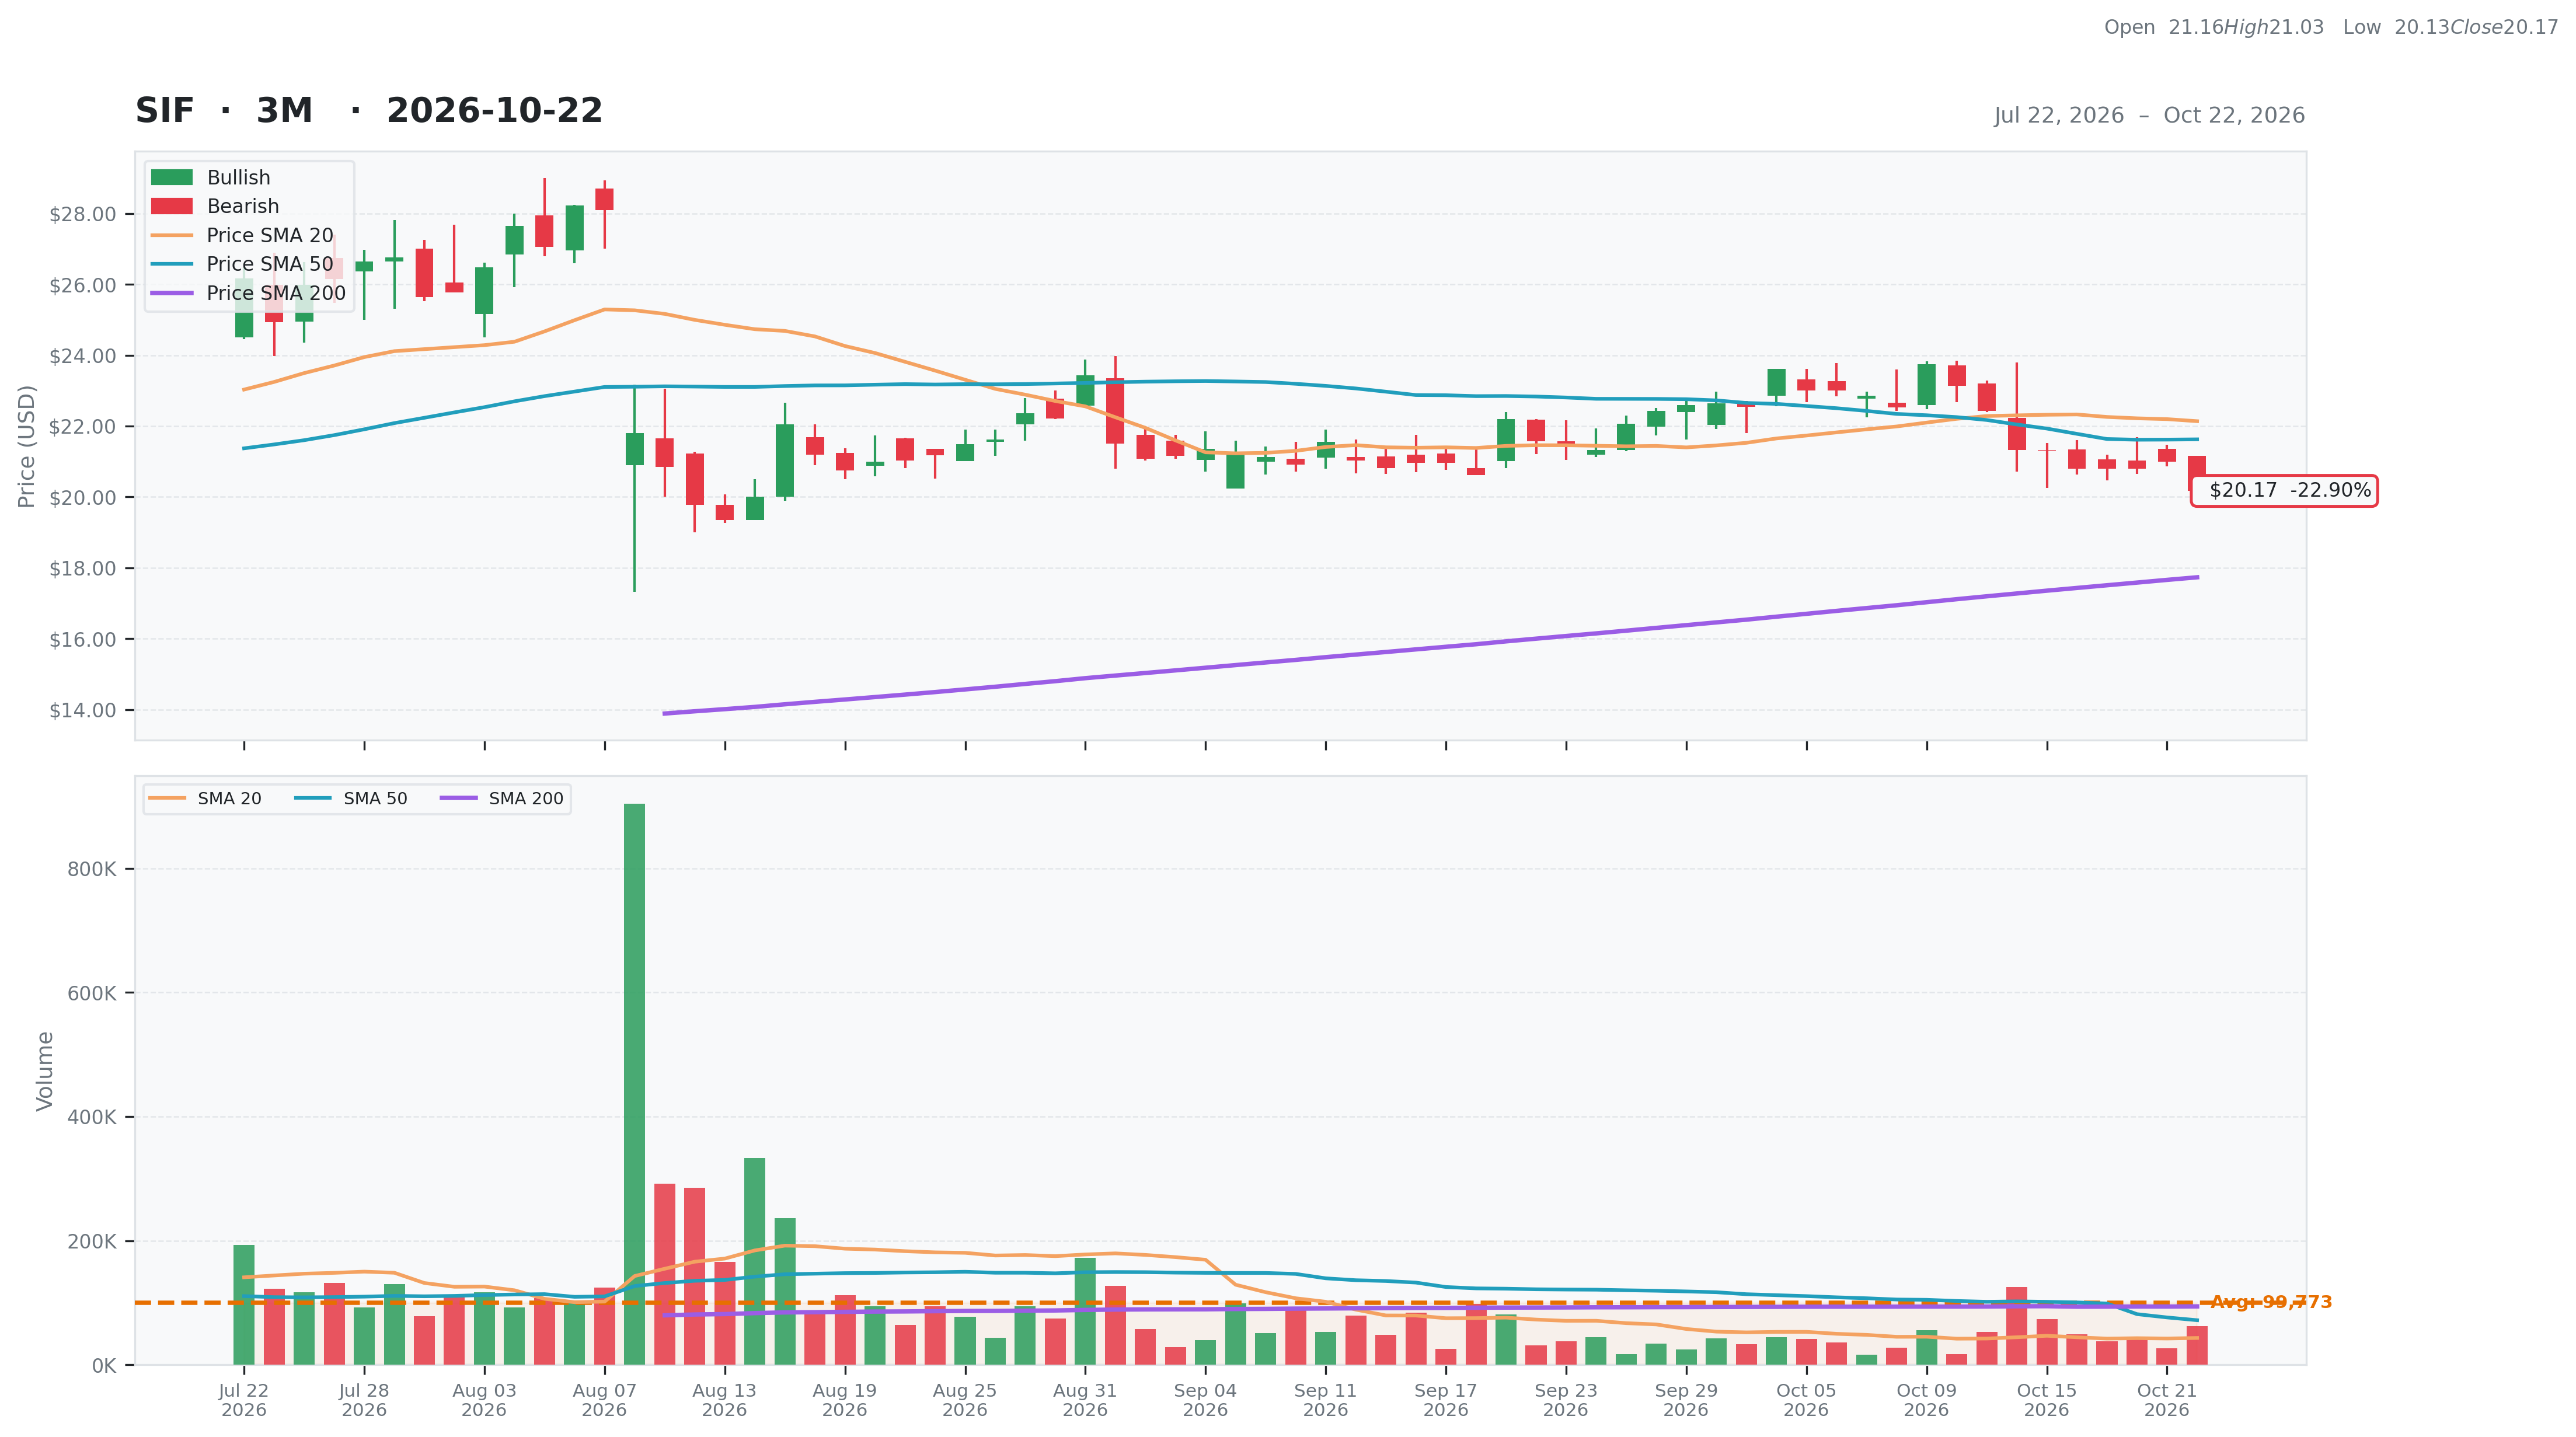
| Total | 37 | Current | $20.17 | 52W High | $28.23 -28.55% | Relative Strength | 0.76 | Beta | 0.74 |
| Business Quality | 1 | Weekly | $21.30 -5.31% | 52W Low | $5.40 273.52% | 3M | -0.22 | Short % | 0.06 |
| Financial Strength | 14 | Monthly | $21.57 -6.49% | Above 50DMA | $21.63 -6.73% | 6M | 0.37 | Risk Score | |
| Growth Outlook | 1 | Quarterly | $25.99 -22.39% | Above 200DMA | $17.73 13.74% | 9M | 2.11 | ||
| Momentum | 2 | Yearly | $7.35 174.42% | 12M | 1.75 | ||||
| Valuation | Financial Strength | Growth/Profitability | |||
|---|---|---|---|---|---|
| Trailing P/E | 33.00 | Cash | 0M | Revenue Growth | 0.18% |
| Forward P/E | N/A | Debt | 20M | Earnings Growth | N/A |
| PEG Ratio | N/A | Debt/Equity | 47.00 | Qtr Earnings Growth | N/A |
| Price/Sales | N/A | Current Ratio | 1.77 | Gross Margin | 0.17% |
| Price/Book | 3.13 | Quick Ratio | 1.22 | Operating Margin | 0.01% |
| EV/Revenue | 1.50 | Operating CF | 4M | Profit Margin | 0.04% |
| EV/EBITDA | 16.08 | Free CF | 2M | EBITDA Margin | 0.09% |
| Ent Value | 149M | Return on Assets | 0.04% | ||
| Return on Equity | 0.10% | ||||
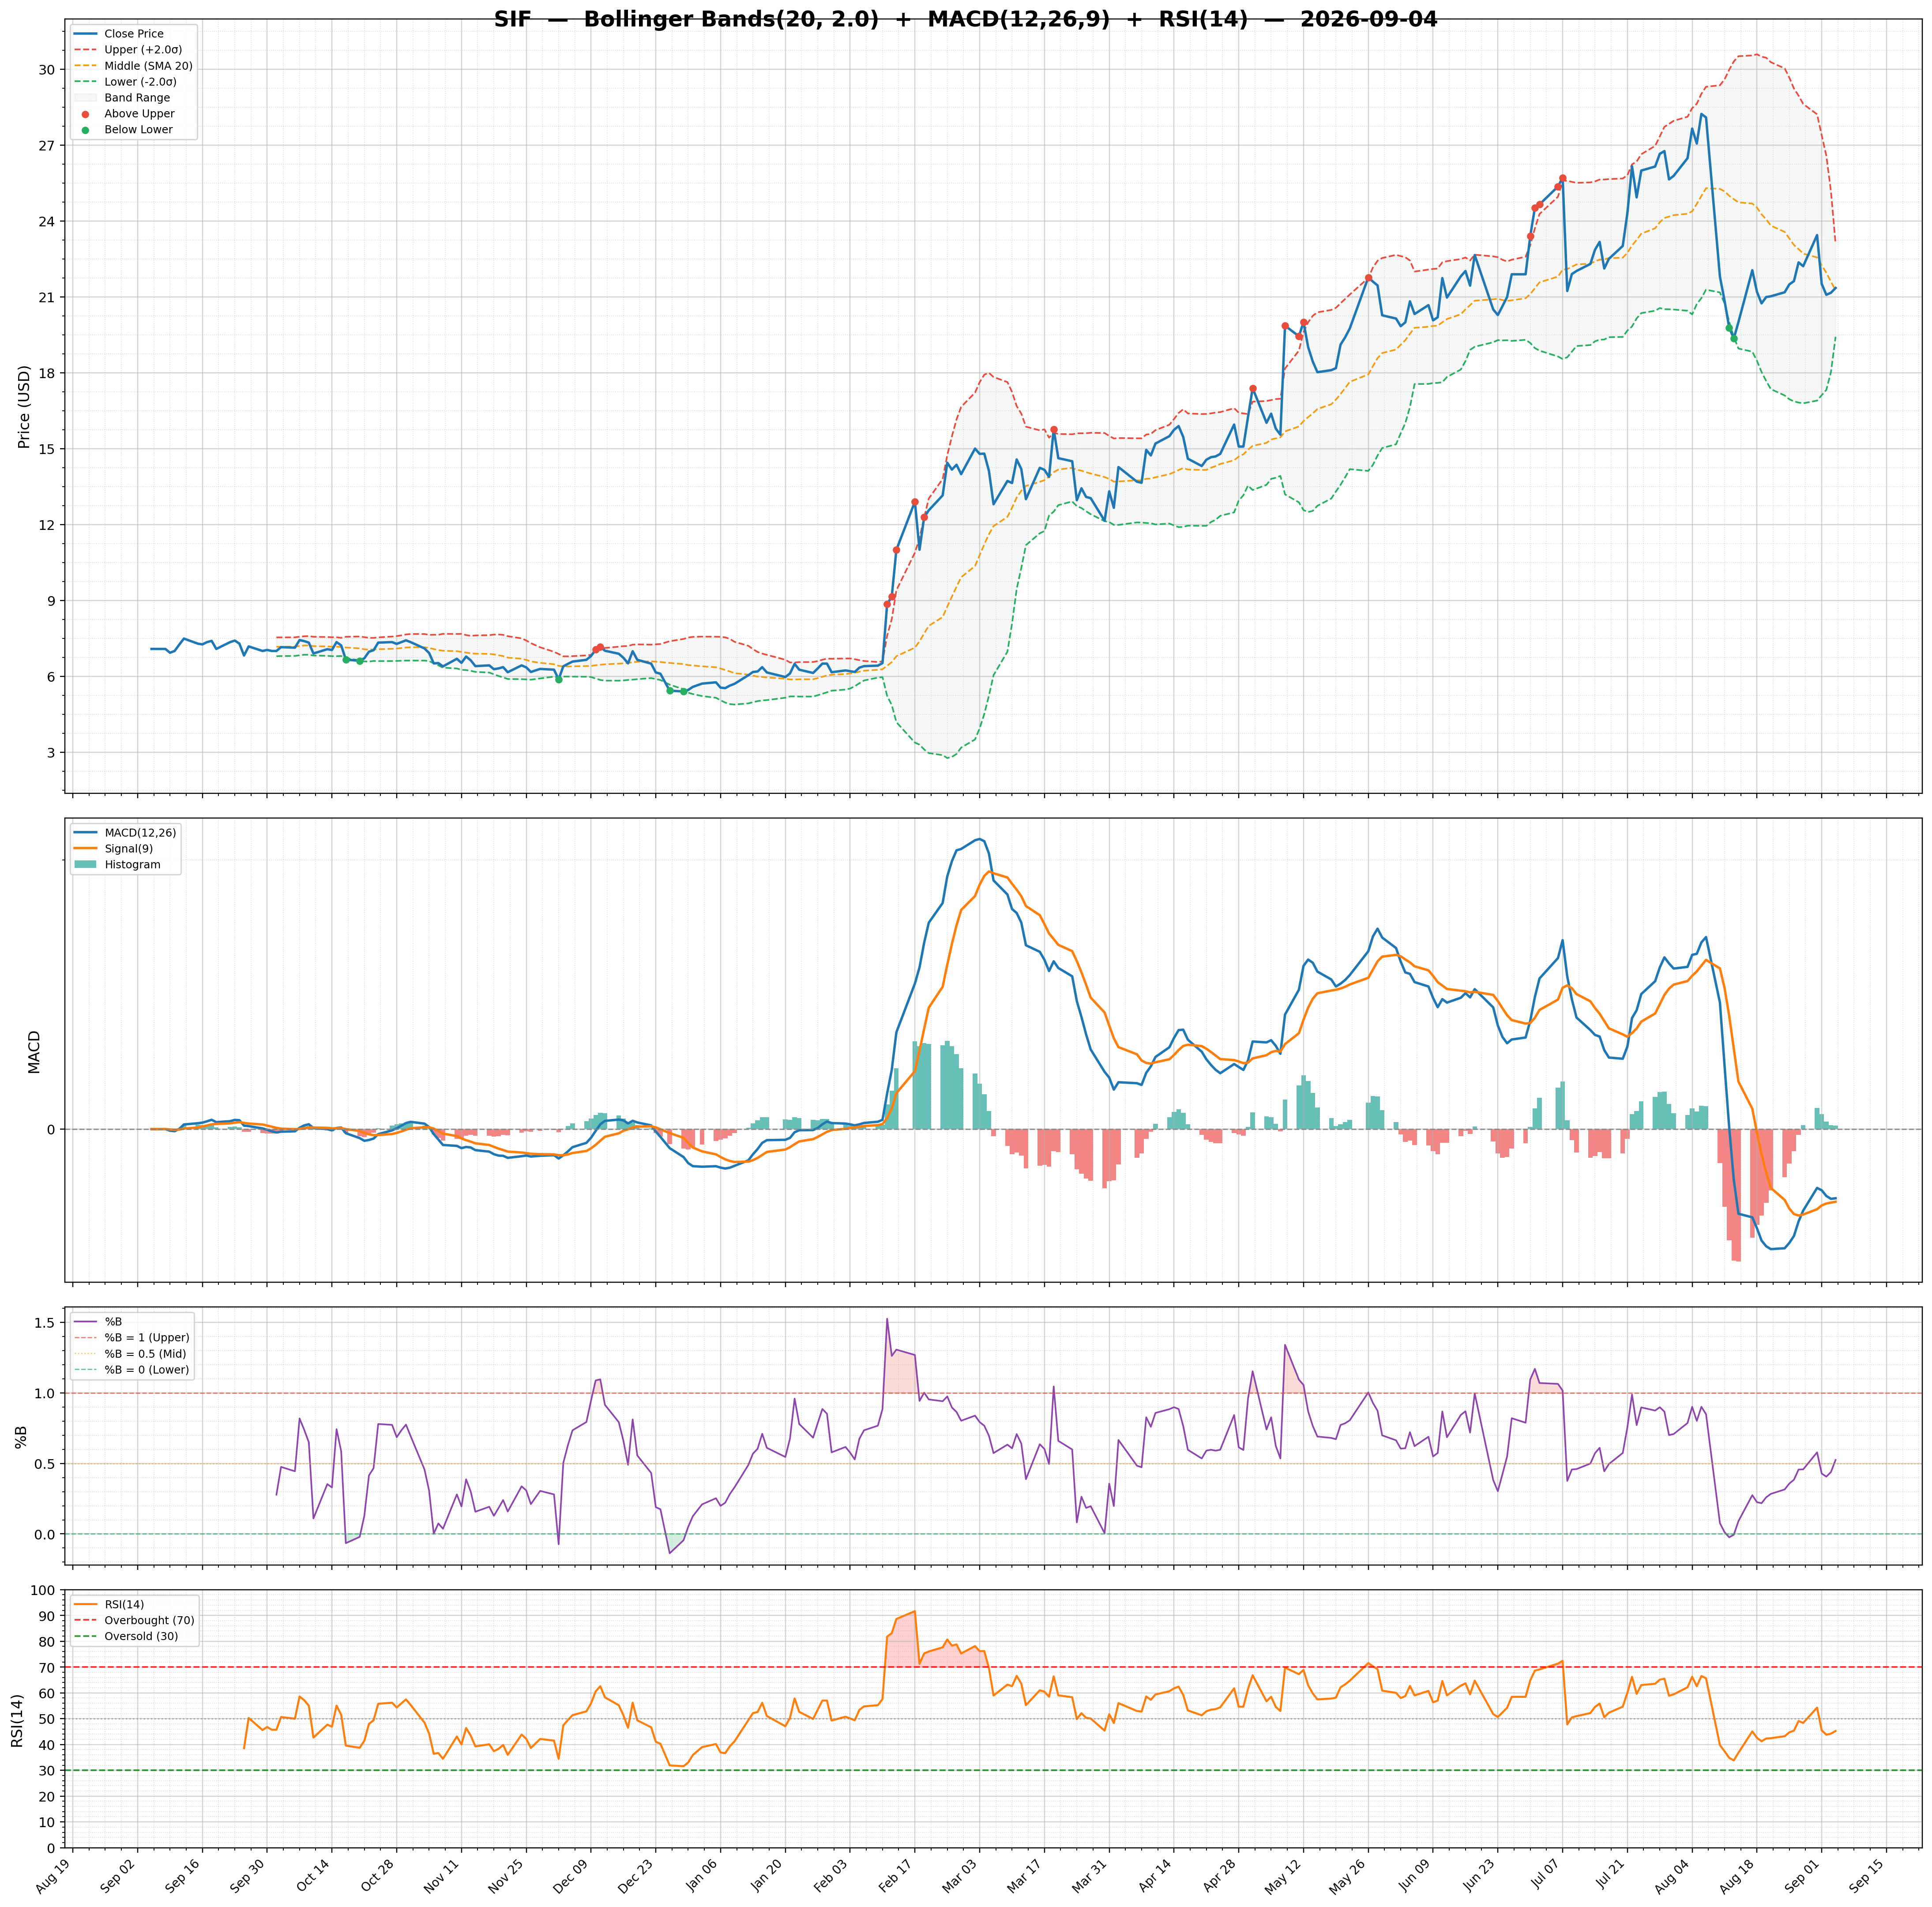
| Technical | Volume & Bollinger Bands | Analyst | |||
|---|---|---|---|---|---|
| RSI | 36.53 | Volume | 0.05M | Rating | none |
| Previous RSI | 42.00 | Avg Volume 20D | 0.04M | Target Mean | N/A |
| RSI Trend | Down | Relative Volume | 1.30 | Target High | N/A |
| MACD | -0.36 | Lower Band | 20.05 | Target Low | N/A |
| MACD Signal | -0.10 | Middle Band | 22.14 | Target Median | N/A |
| Histogram | -0.27 | Upper Band | 24.23 | Analysts | N/A |
| Previous Histogram | -0.24 | Bandwidth | 18.860 | Upside | N/A |
| Histogram Trend | Decreasing | %B | 0.03 | ||