Sandisk Corporation (SNDK)
Technology • Computer Hardware • $1260.93 • MCap: 187,784,675,328
https://www.sandisk.com • Sandisk Corporation develops, manufactures, and sells data storage devices and solutions using NAND flash technology in the Americas, Europe, the Middle East, Africa, Asia, and internationally. The company provides solid state drives for desktop and notebook PCs, gaming consoles, and set top boxes; and flash-based embedded storage products for mobile phones, tablets, notebook PCs and other portable and wearable devices, automotive applications, Internet of Things, industrial, and connected home applications, as well as removable cards, universal serial bus drives, and wafers and components. It sells its products to computer manufacturers and original equipment manufacturers, datacenters, private cloud customers, cloud service providers, resellers, distributors, and retailers through its sales personnel, dealers, distributors, retailers, and subsidiaries. Sandisk Corporation was incorporated in 2024 and is based in Milpitas, California.
Test1
| Score | Price | 52 Week & Averages | Relative Strength | Risk | |||||
|---|---|---|---|---|---|---|---|---|---|
| Total | 77 | Current | $1,260.93 | 52W High | $2,335.00 -46.00% | Relative Strength | 1.48 | Beta | N/A |
| Business Quality | 25 | Weekly | $1,394.83 -9.60% | 52W Low | $167.05 654.82% | 3M | -0.12 | Short % | 0.03 |
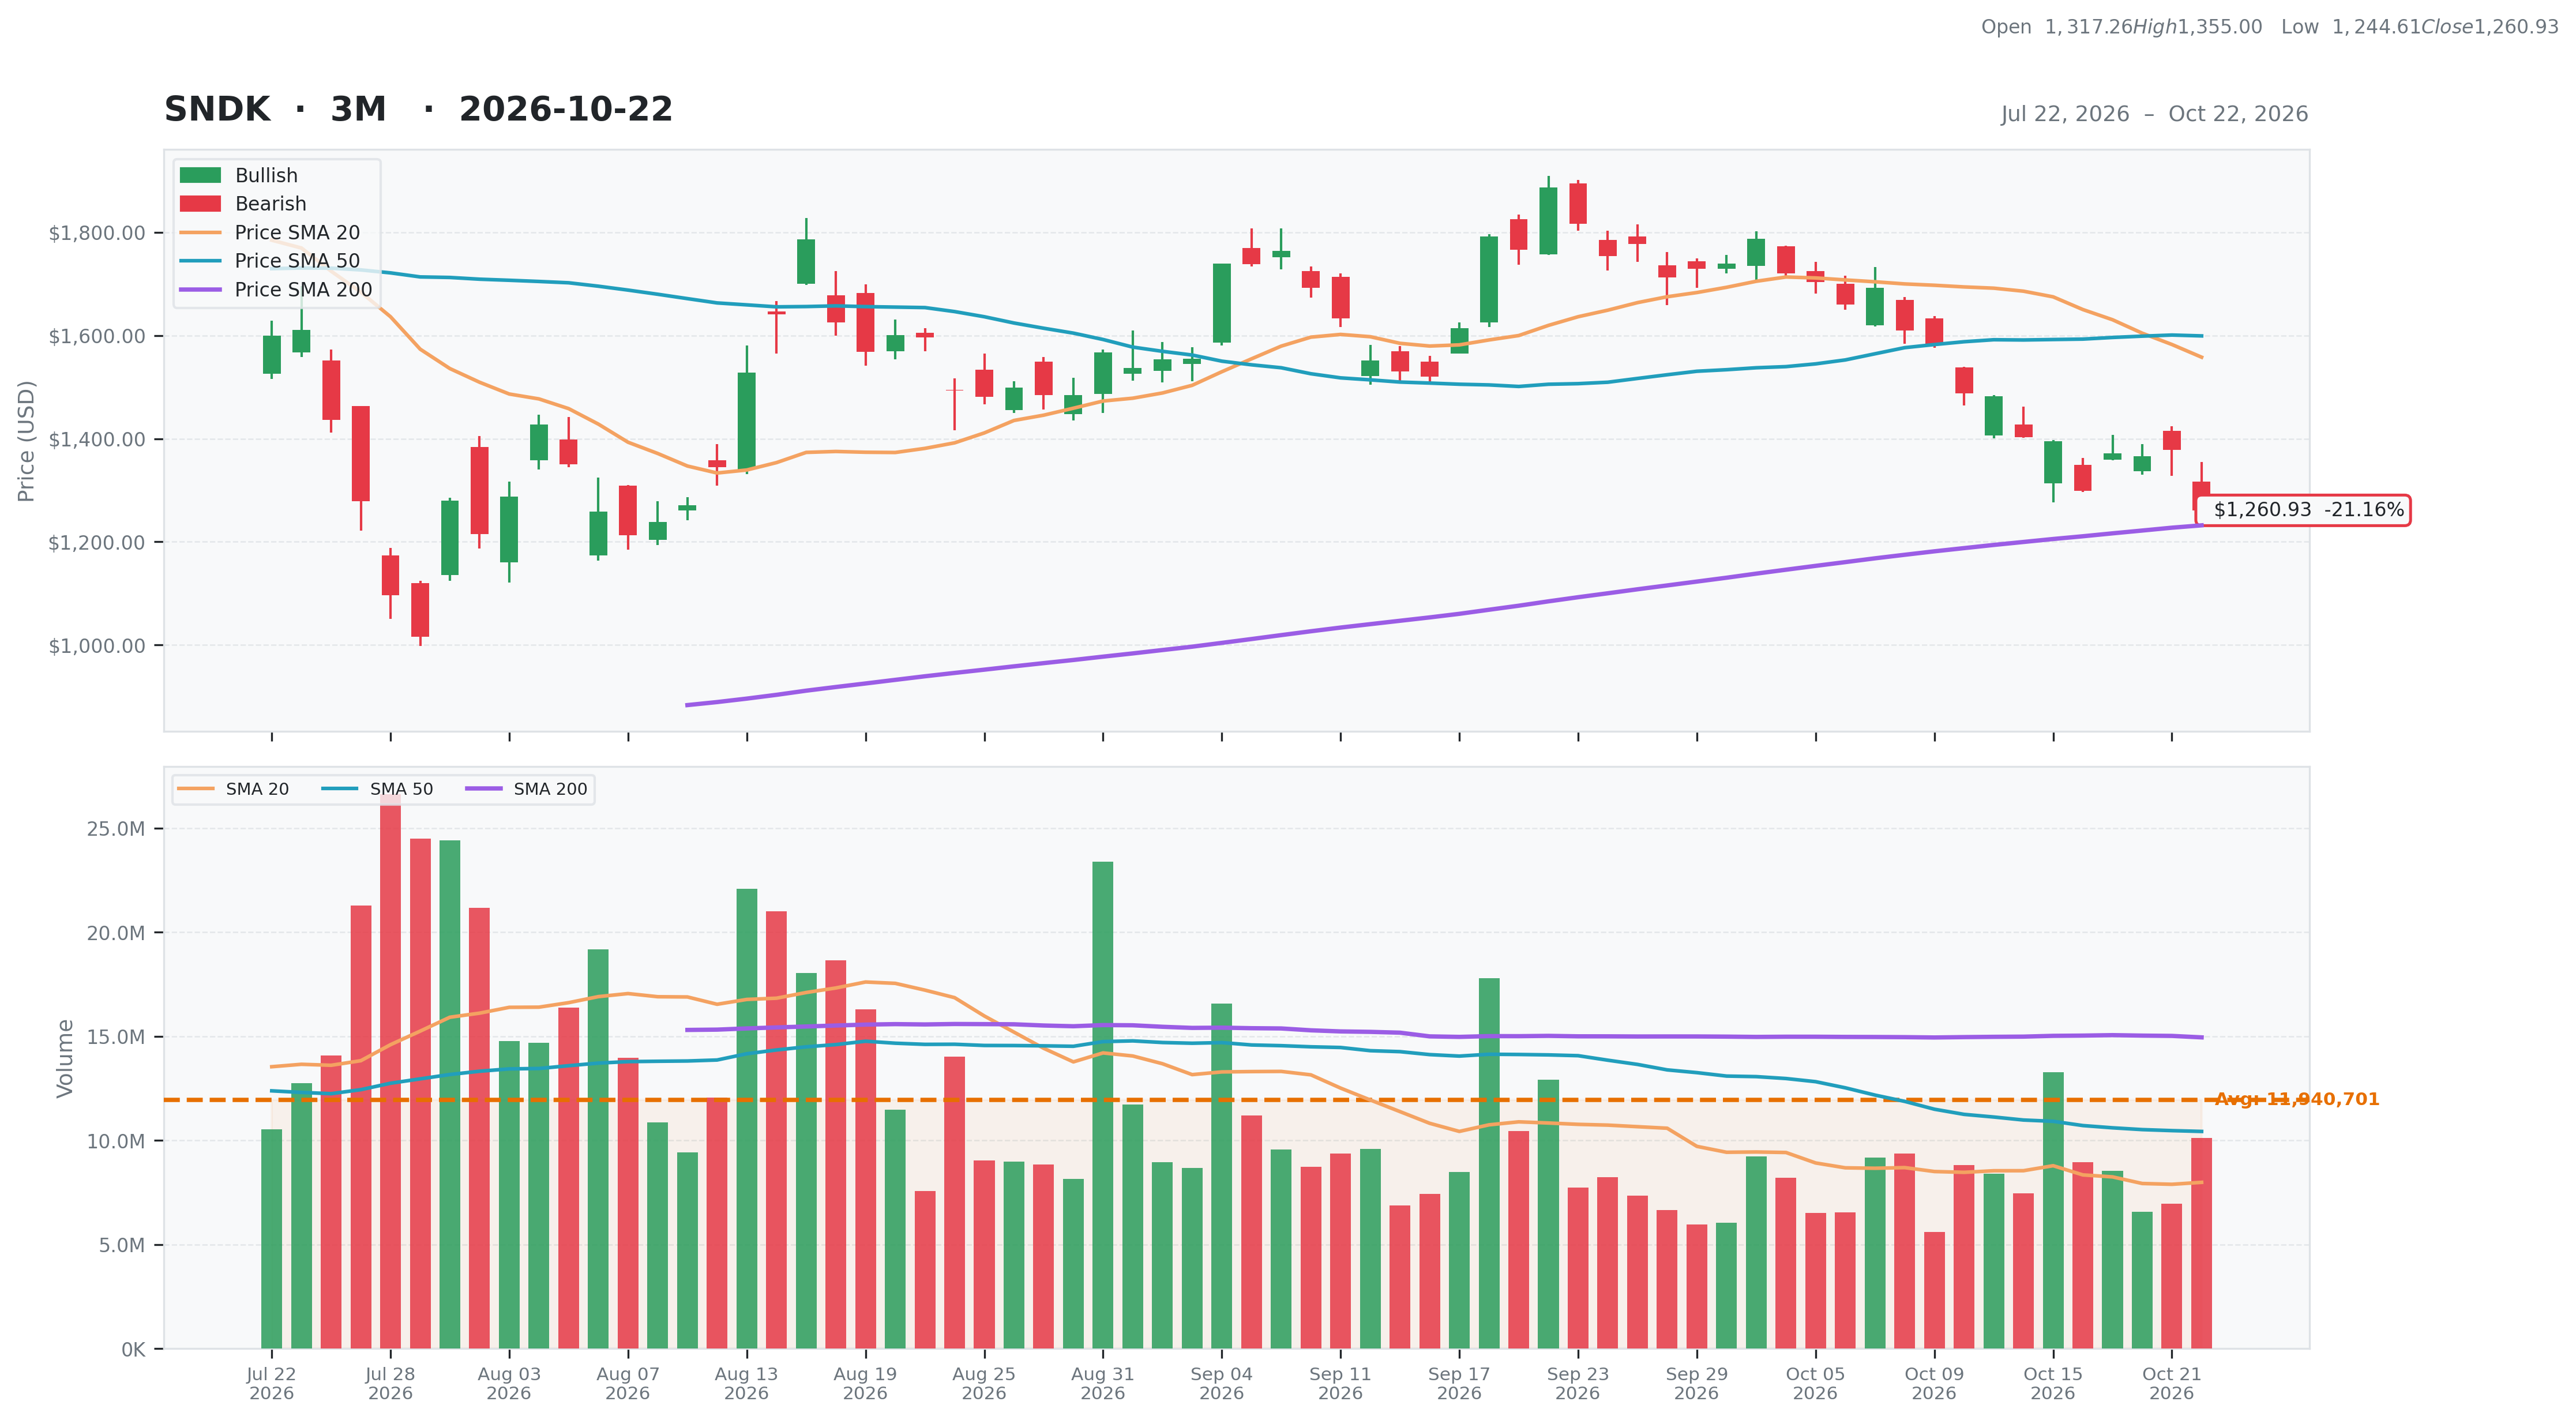
| Financial Strength | 22 | Monthly | $1,887.04 -33.18% | Above 50DMA | $1,599.25 -21.16% | 6M | 0.35 | Risk Score | 9 |
| Growth Outlook | 5 | Quarterly | $1,436.56 -12.23% | Above 200DMA | $1,231.91 2.36% | 9M | 1.50 | ||
| Momentum | 5 | Yearly | $176.49 614.45% | 12M | 5.77 | ||||
| Valuation | Financial Strength | Growth/Profitability | |||
|---|---|---|---|---|---|
| Trailing P/E | 17.62 | Cash | 4,762M | Revenue Growth | 3.72% |
| Forward P/E | 4.88 | Debt | 201M | Earnings Growth | N/A |
| PEG Ratio | N/A | Debt/Equity | 1.28 | Qtr Earnings Growth | N/A |
| Price/Sales | 9.27 | Current Ratio | 2.29 | Gross Margin | 0.71% |
| Price/Book | 12.30 | Quick Ratio | 1.71 | Operating Margin | 0.78% |
| EV/Revenue | 9.17 | Operating CF | 11,671M | Profit Margin | 0.56% |
| EV/EBITDA | 14.72 | Free CF | 7,721M | EBITDA Margin | 0.62% |
| Ent Value | 185,681M | Return on Assets | 0.44% | ||
| Return on Equity | 0.92% | ||||
| Technical | Volume & Bollinger Bands | Analyst | |||
|---|---|---|---|---|---|
| RSI | 31.34 | Volume | 8.84M | Rating | buy |
| Previous RSI | 37.07 | Avg Volume 20D | 7.98M | Target Mean | $2,173.00 |
| RSI Trend | Down | Relative Volume | 1.17 | Target High | $3,600.00 |
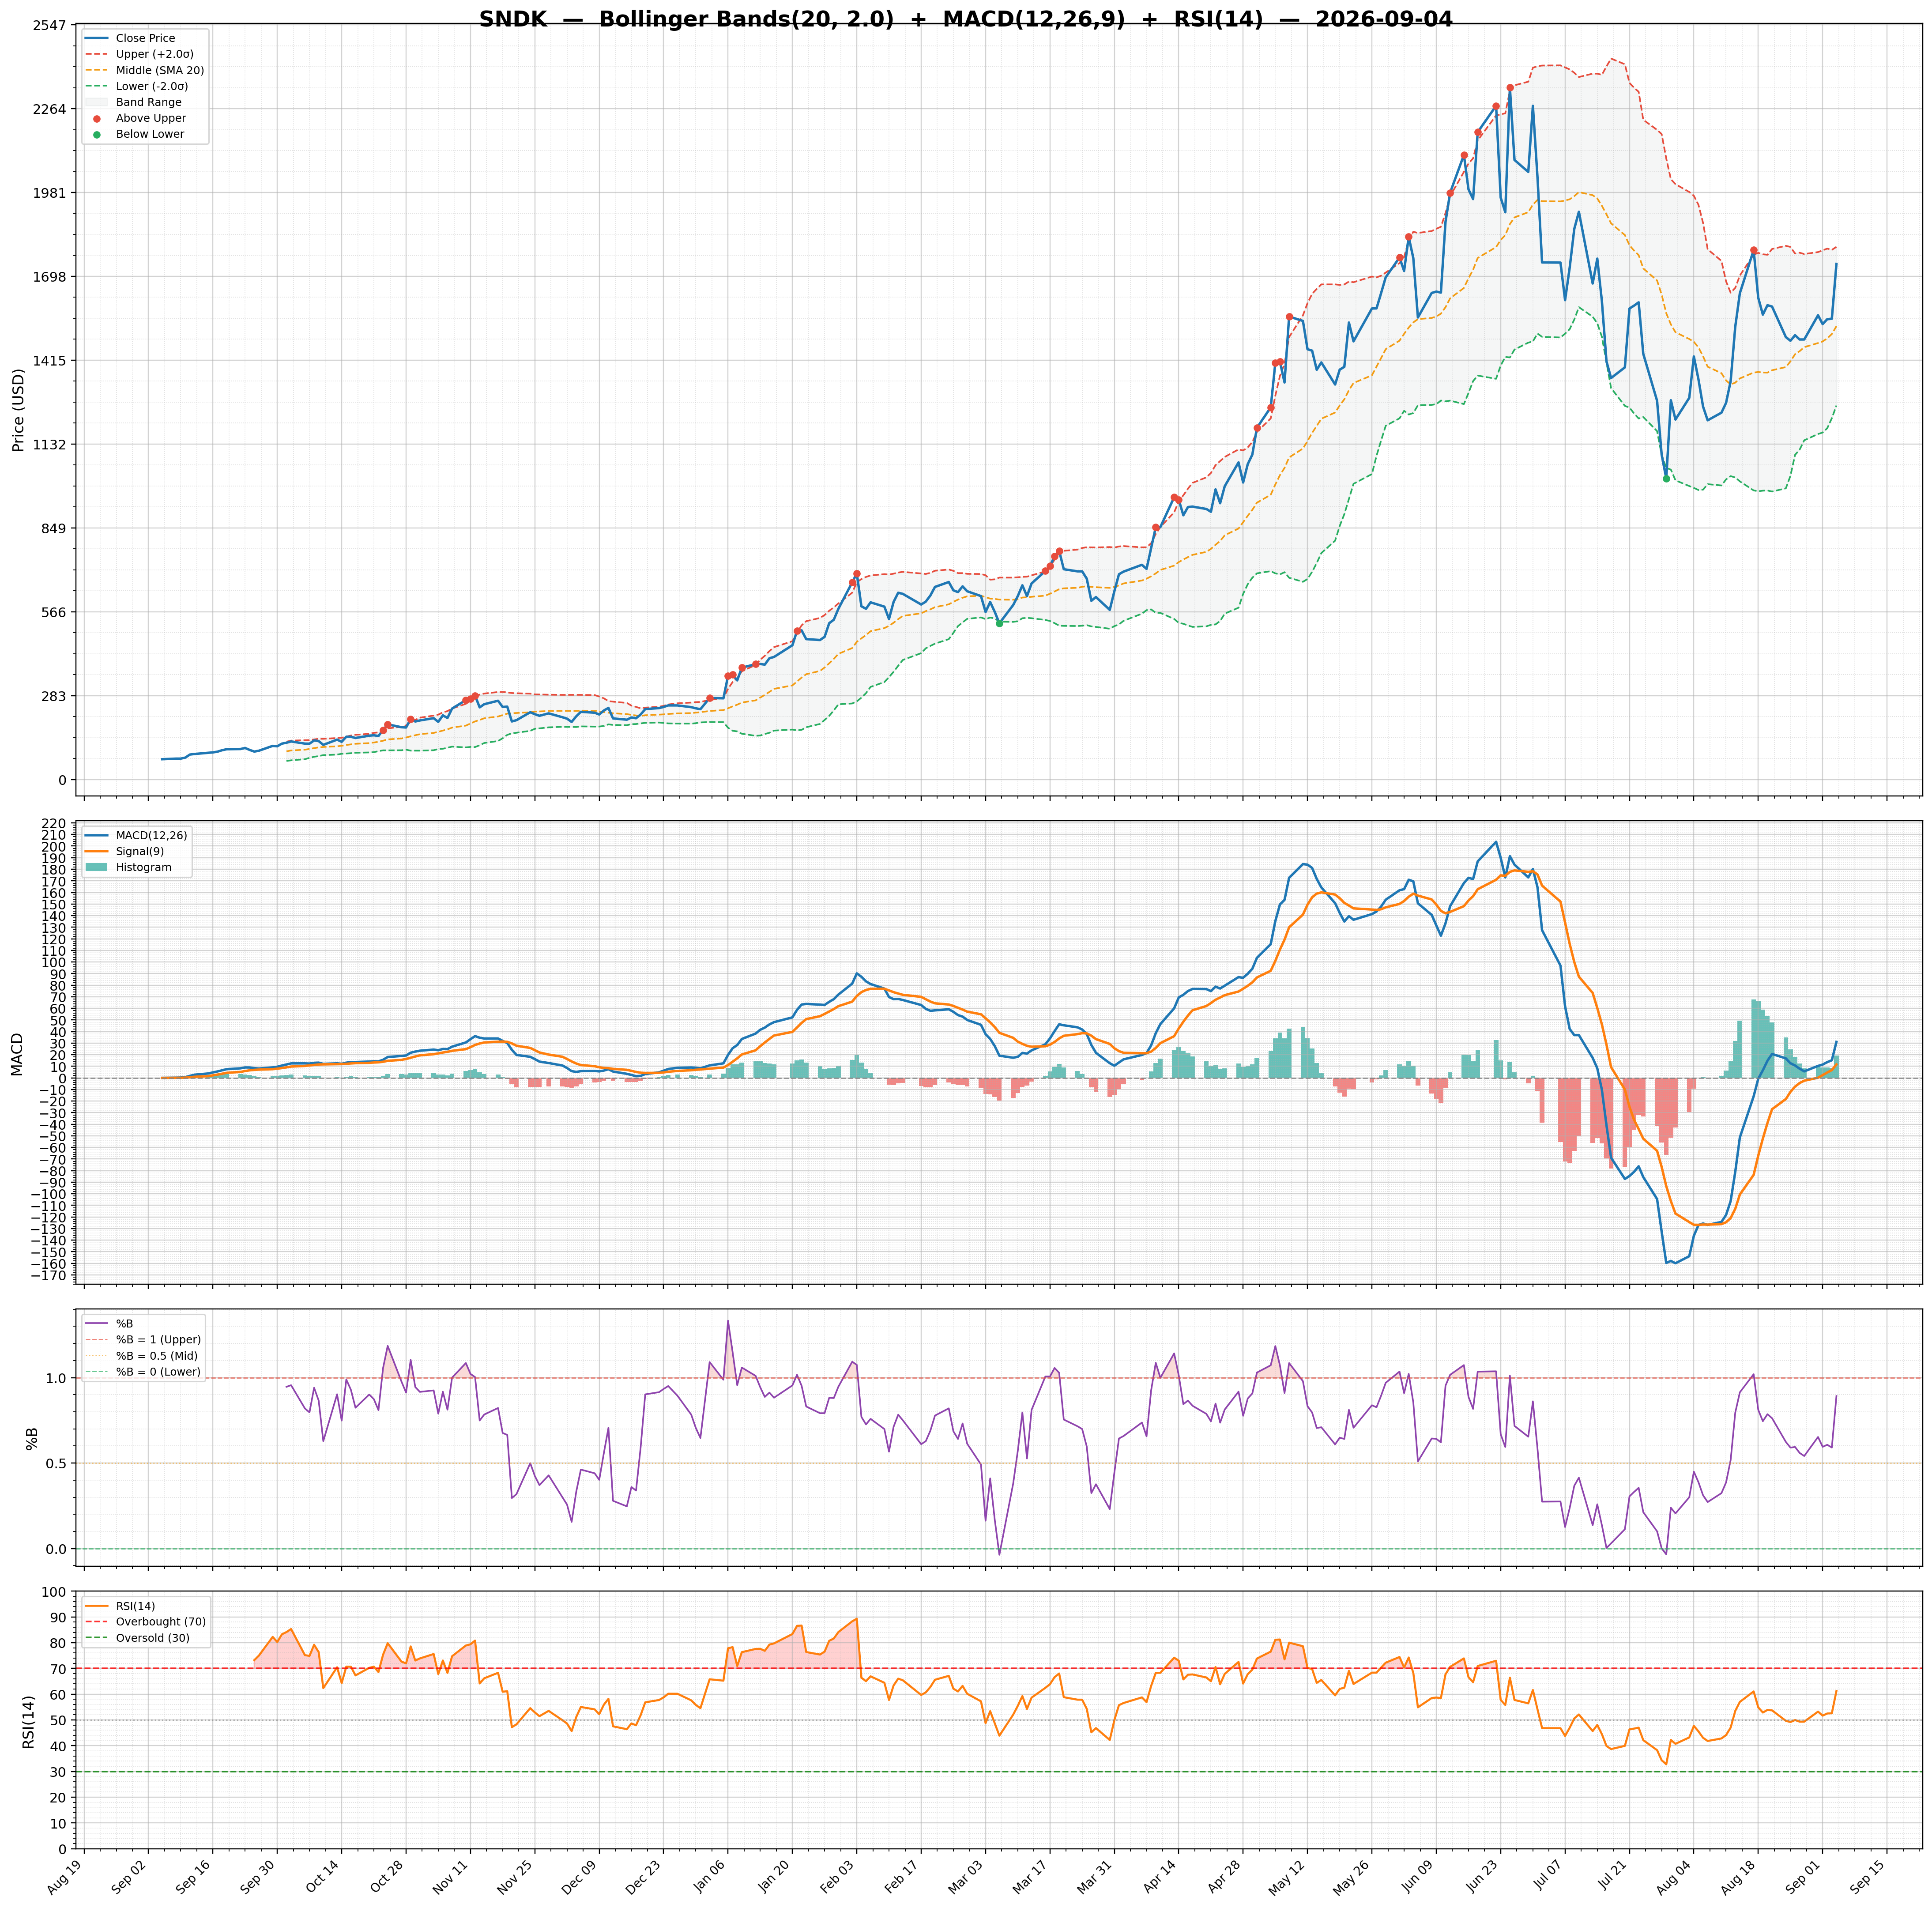
| MACD | -89.88 | Lower Band | 1,206.17 | Target Low | $1,000.00 |
| MACD Signal | -54.82 | Middle Band | 1,557.96 | Target Median | $2,150.00 |
| Histogram | -35.06 | Upper Band | 1,909.74 | Analysts | 24 |
| Previous Histogram | -33.71 | Bandwidth | 45.160 | Upside | 67.24% |
| Histogram Trend | Decreasing | %B | 0.08 | ||