Sable Offshore Corp. (SOC)
Energy • Oil & Gas Drilling • $3.04 • MCap: 637,006,976
https://www.sableoffshore.com • Sable Offshore Corp. operates as an independent oil and gas company in the United States. The company operates through three platforms located in federal waters offshore California. It also owns and operates 16 federal leases across approximately 76,000 acres, as well as subsea pipelines that transports crude oil, natural gas, and produced water from the platforms to the onshore processing facilities. The company was formerly known as Flame Acquisition Corp. and changed its name to Sable Offshore Corp. in February 2024. Sable Offshore Corp. was incorporated in 2020 and is headquartered in Houston, Texas.
Notes
10/05/2026
Exit / avoid
| Score | Price | 52 Week & Averages | Relative Strength | Risk | |||||
|---|---|---|---|---|---|---|---|---|---|
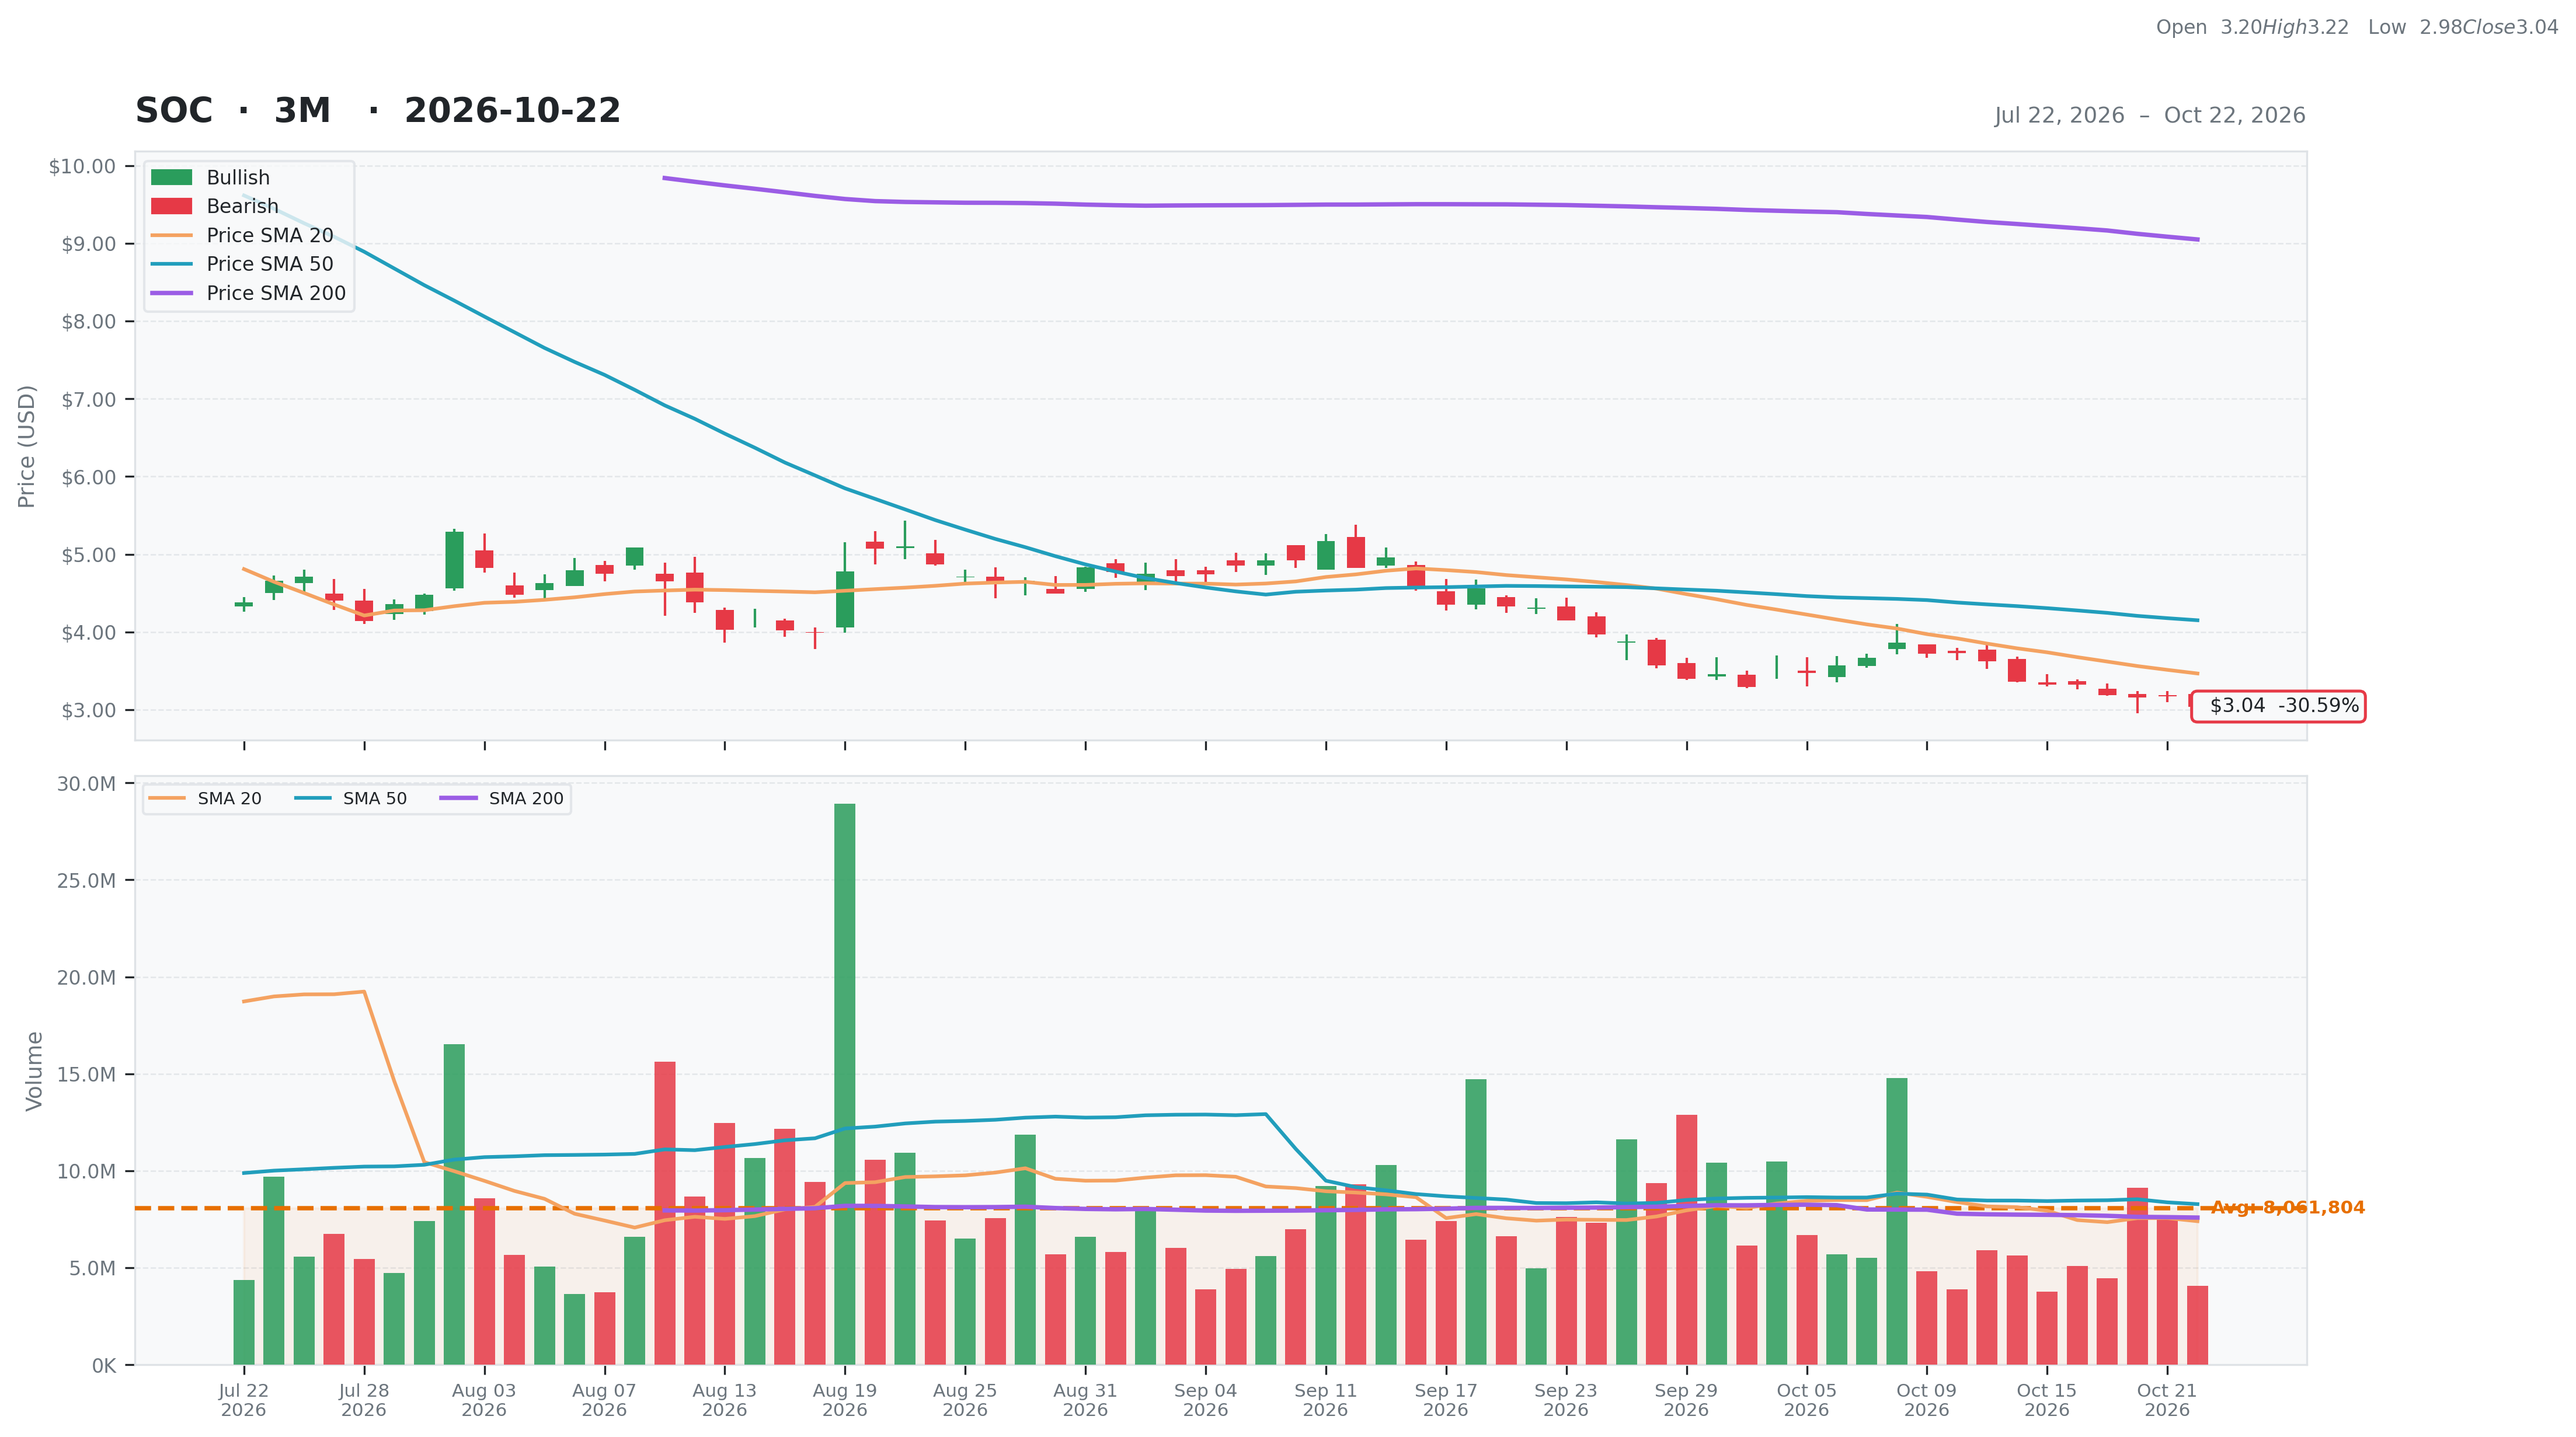
| Total | 26 | Current | $3.04 | 52W High | $18.45 -83.52% | Relative Strength | -0.60 | Beta | -0.13 |
| Business Quality | 1 | Weekly | $3.32 -8.43% | 52W Low | $3.04 0.00% | 3M | -0.35 | Short % | 0.36 |
| Financial Strength | 1 | Monthly | $4.31 -29.47% | Above 50DMA | $4.15 -26.75% | 6M | -0.79 | Risk Score | 10 |
| Growth Outlook | 1 | Quarterly | $4.71 -35.46% | Above 200DMA | $9.05 -66.41% | 9M | -0.75 | ||
| Momentum | 3 | Yearly | $12.85 -76.34% | 12M | -0.77 | ||||
| Valuation | Financial Strength | Growth/Profitability | |||
|---|---|---|---|---|---|
| Trailing P/E | N/A | Cash | 22M | Revenue Growth | N/A |
| Forward P/E | 2.14 | Debt | 988M | Earnings Growth | N/A |
| PEG Ratio | N/A | Debt/Equity | 250.01 | Qtr Earnings Growth | N/A |
| Price/Sales | 4.60 | Current Ratio | 0.24 | Gross Margin | -1.28% |
| Price/Book | 1.30 | Quick Ratio | 0.16 | Operating Margin | -0.49% |
| EV/Revenue | 11.58 | Operating CF | -282M | Profit Margin | 0.00% |
| EV/EBITDA | -4.53 | Free CF | -494M | EBITDA Margin | -2.56% |
| Ent Value | 1,603M | Return on Assets | -0.14% | ||
| Return on Equity | -1.03% | ||||
| Technical | Volume & Bollinger Bands | Analyst | |||
|---|---|---|---|---|---|
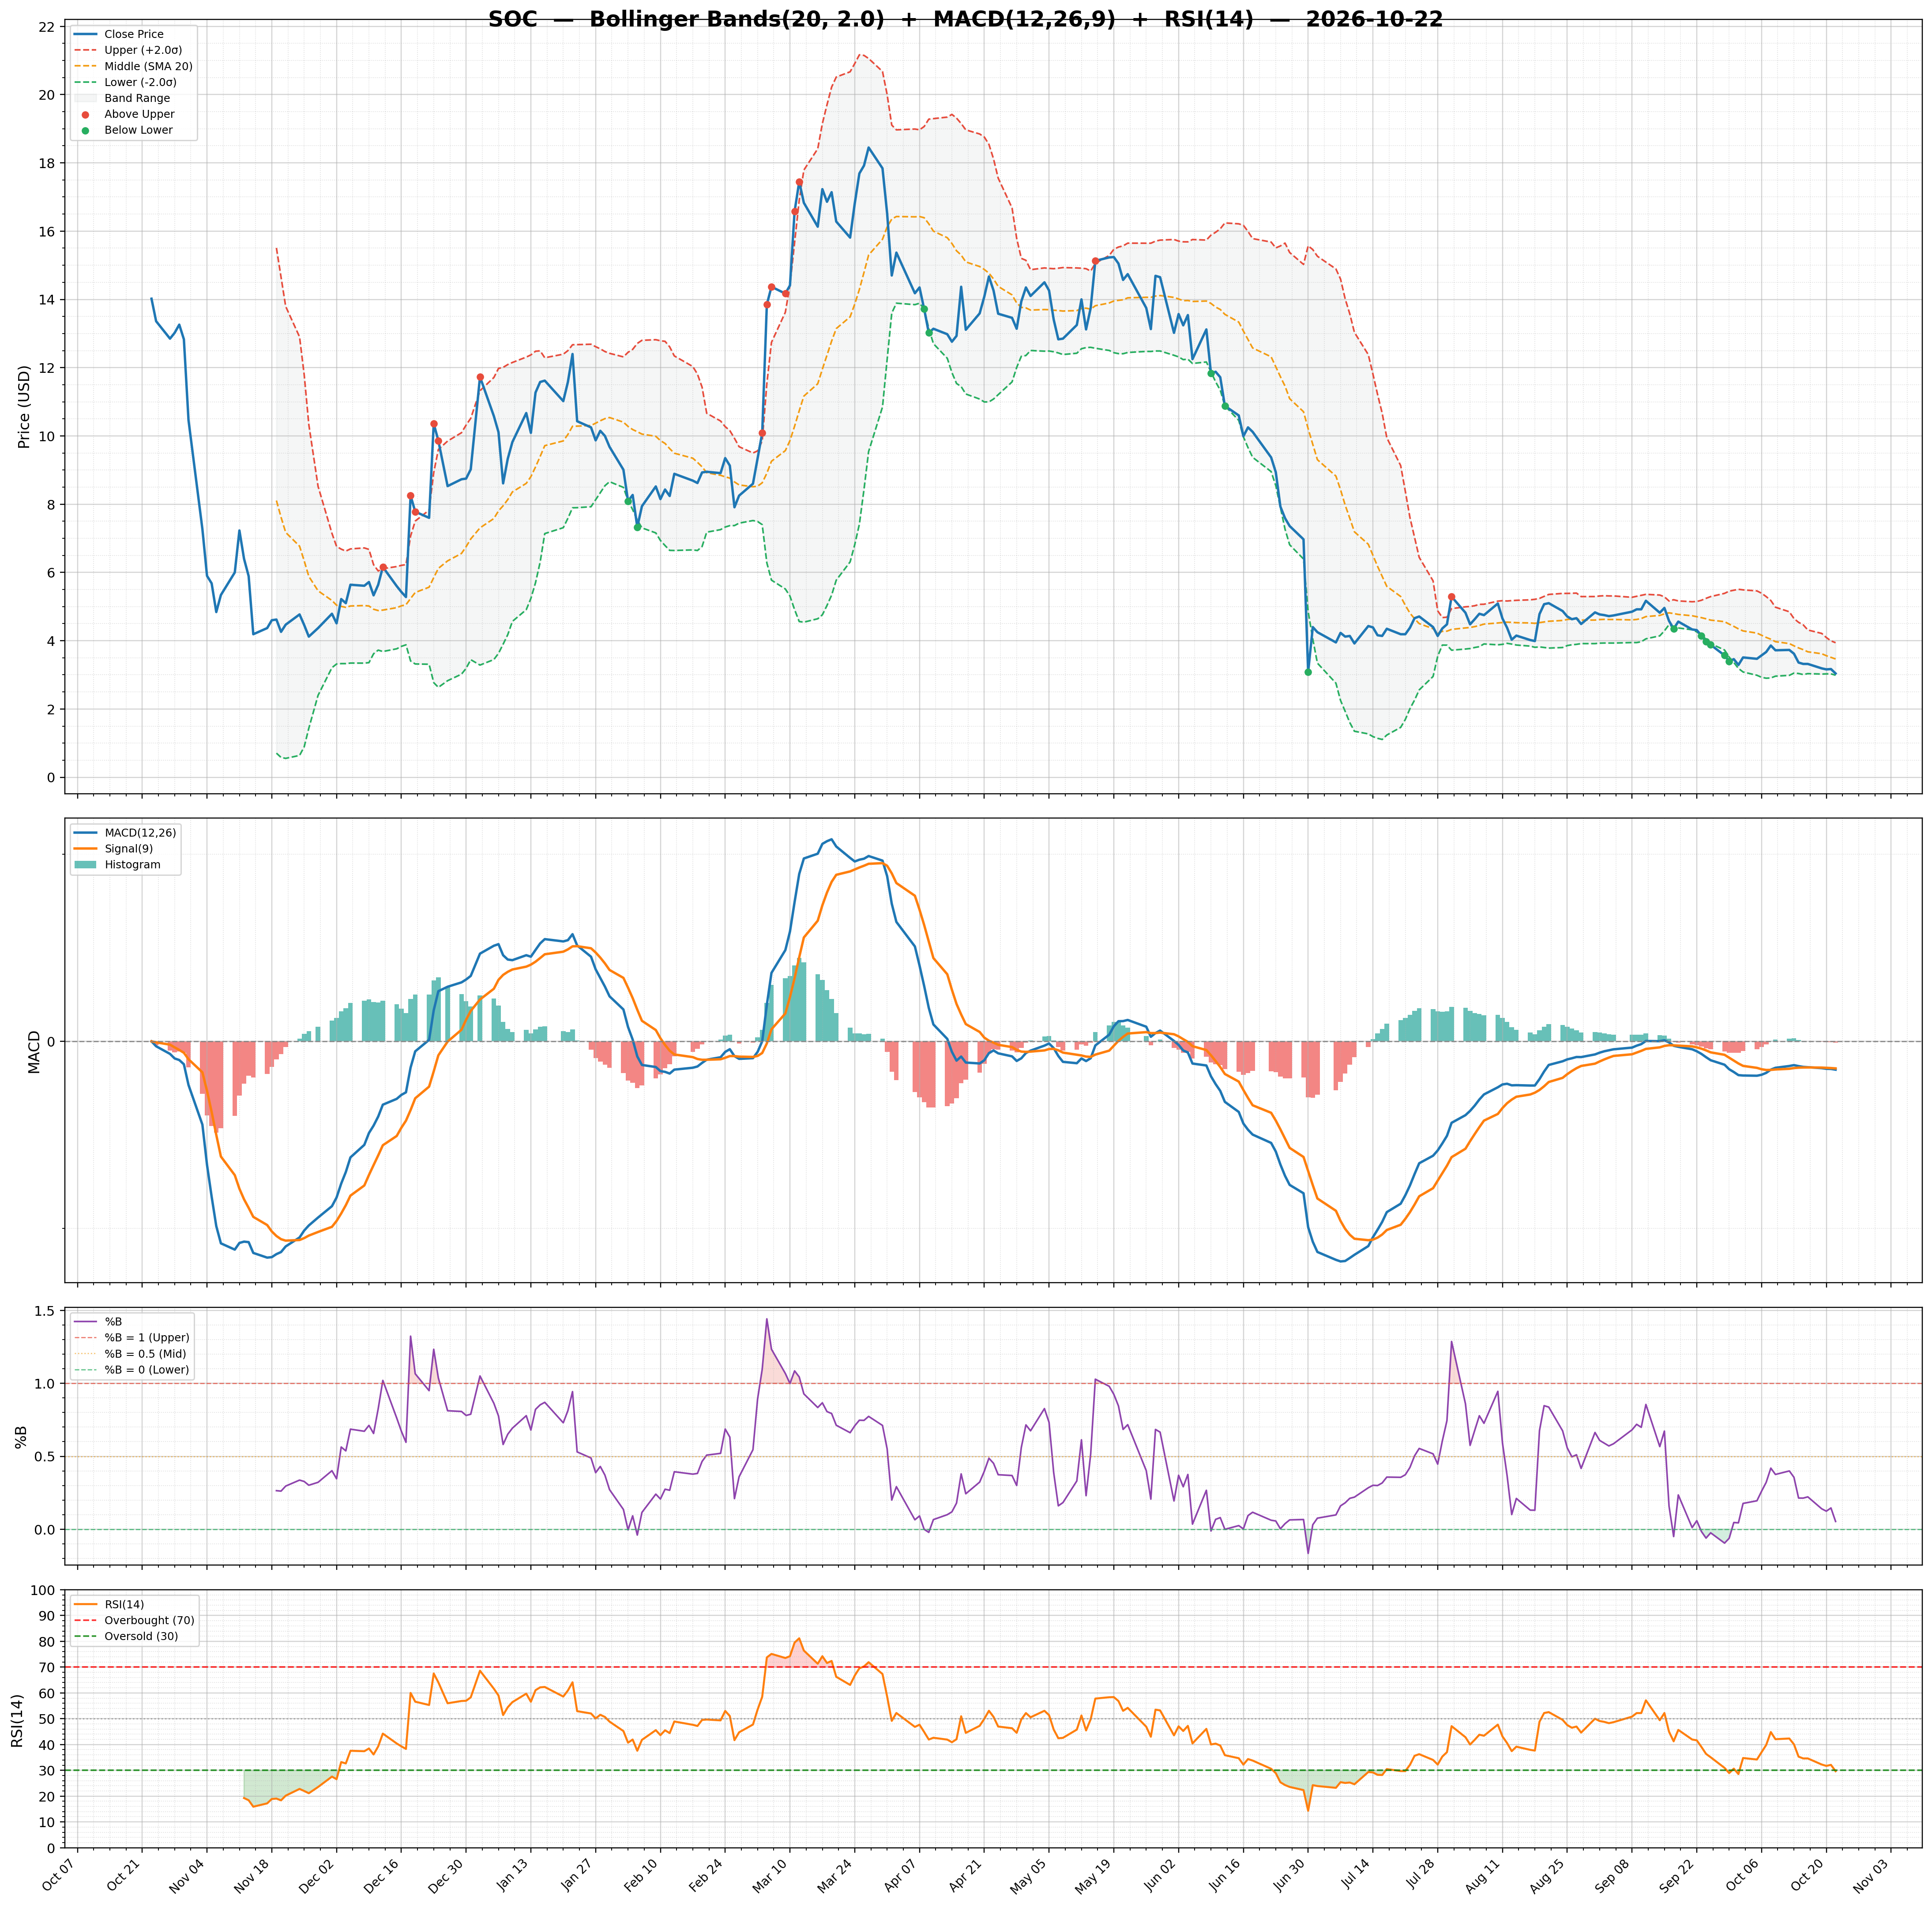
| RSI | 29.66 | Volume | 5.03M | Rating | strong_buy |
| Previous RSI | 32.12 | Avg Volume 20D | 7.4M | Target Mean | $9.50 |
| RSI Trend | Down | Relative Volume | 0.53 | Target High | $11.00 |
| MACD | -0.30 | Lower Band | 2.99 | Target Low | $8.00 |
| MACD Signal | -0.29 | Middle Band | 3.46 | Target Median | $9.50 |
| Histogram | -0.01 | Upper Band | 3.94 | Analysts | 6 |
| Previous Histogram | -0.01 | Bandwidth | 27.490 | Upside | 186.14% |
| Histogram Trend | Decreasing | %B | 0.05 | ||