iShares PHLX SOX Semiconductor (SOXX)
• • $475.69 • MCap:
• The fund generally will invest at least 80% of its assets in the component securities of its index and in investments that have economic characteristics that are substantially identical to the component securities of its index and may invest up to 20% of its assets in certain futures, options and swap contracts, cash and cash equivalents. The fund is non-diversified.
Sector
Joie
| Score | Price | 52 Week & Averages | Relative Strength | Risk | |||||
|---|---|---|---|---|---|---|---|---|---|
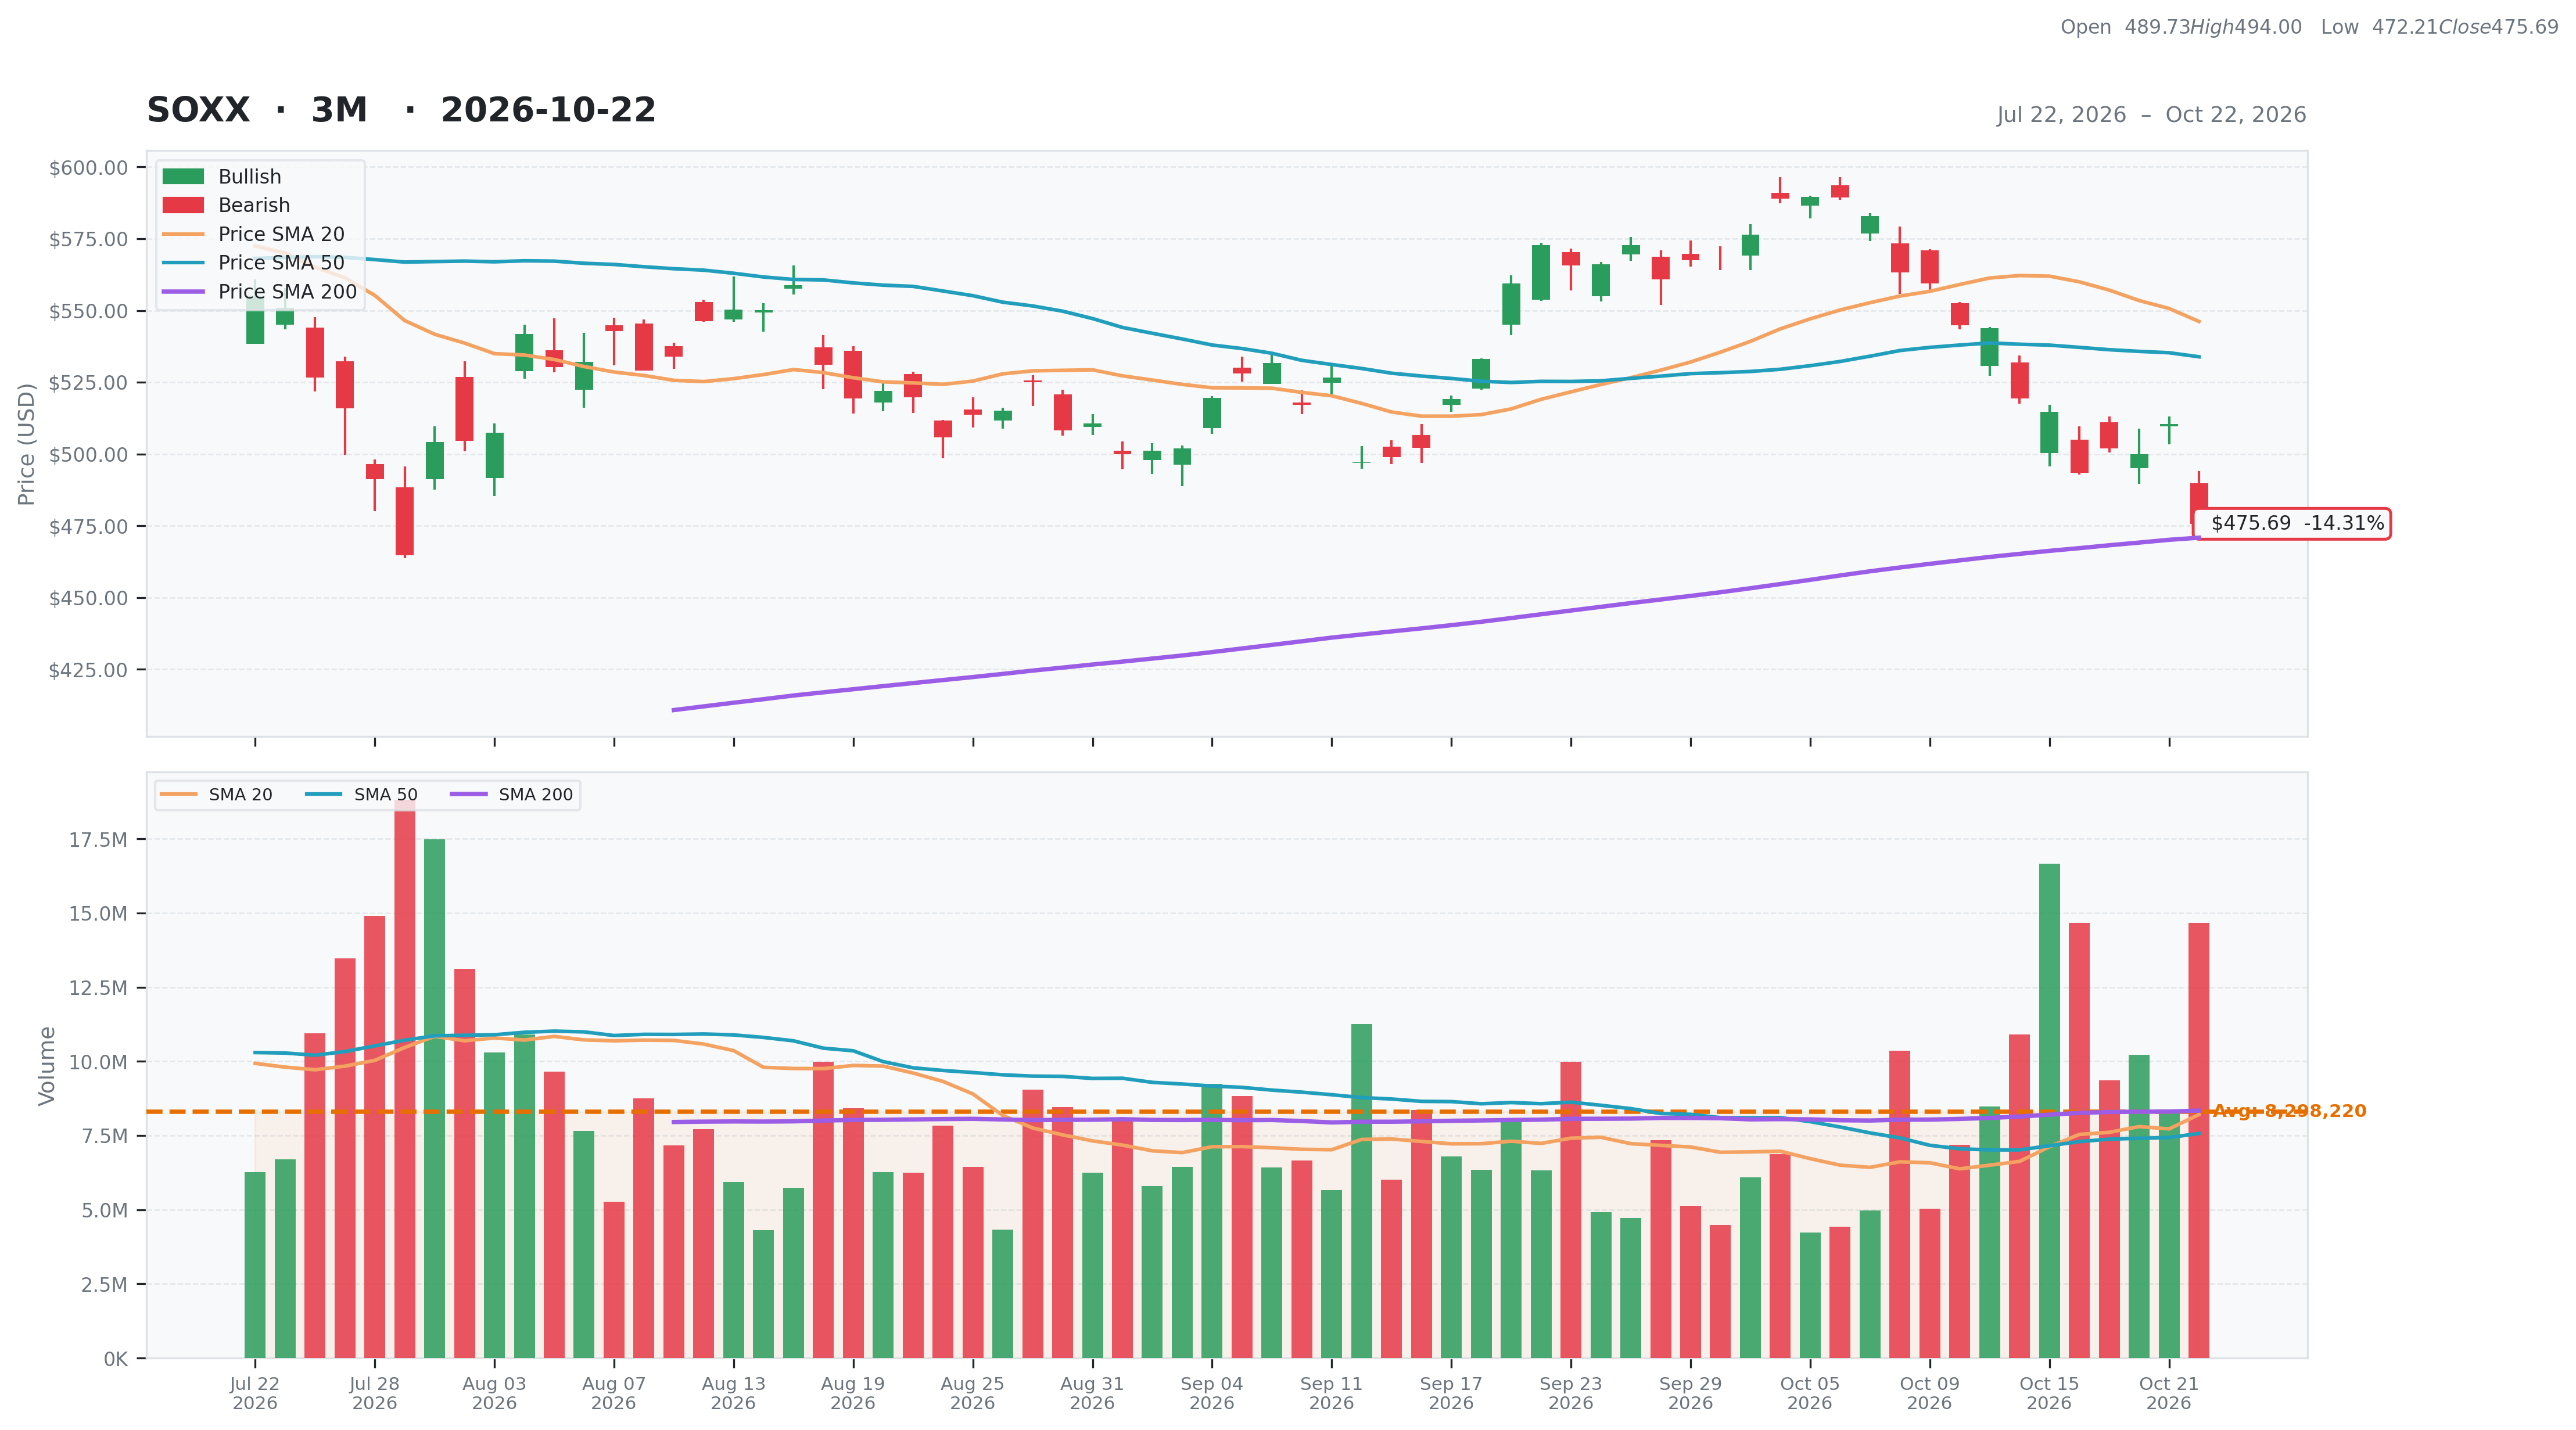
| Total | 28 | Current | $475.69 | 52W High | $654.58 -27.33% | Relative Strength | 0.17 | Beta | N/A |
| Business Quality | 1 | Weekly | $514.71 -7.58% | 52W Low | $267.24 78.00% | 3M | -0.10 | Short % | |
| Financial Strength | 6 | Monthly | $572.78 -16.95% | Above 50DMA | $533.87 -10.90% | 6M | 0.08 | Risk Score | |
| Growth Outlook | 1 | Quarterly | $526.67 -9.68% | Above 200DMA | $470.86 1.03% | 9M | 0.37 | ||
| Momentum | 2 | Yearly | $303.11 56.94% | 12M | 0.61 | ||||
| Valuation | Financial Strength | Growth/Profitability | |||
|---|---|---|---|---|---|
| Trailing P/E | 29.01 | Cash | N/A | Revenue Growth | N/A |
| Forward P/E | N/A | Debt | N/A | Earnings Growth | N/A |
| PEG Ratio | N/A | Debt/Equity | N/A | Qtr Earnings Growth | N/A |
| Price/Sales | N/A | Current Ratio | N/A | Gross Margin | N/A |
| Price/Book | 1.16 | Quick Ratio | N/A | Operating Margin | N/A |
| EV/Revenue | N/A | Operating CF | N/A | Profit Margin | N/A |
| EV/EBITDA | N/A | Free CF | N/A | EBITDA Margin | N/A |
| Ent Value | N/A | Return on Assets | N/A | ||
| Return on Equity | N/A | ||||
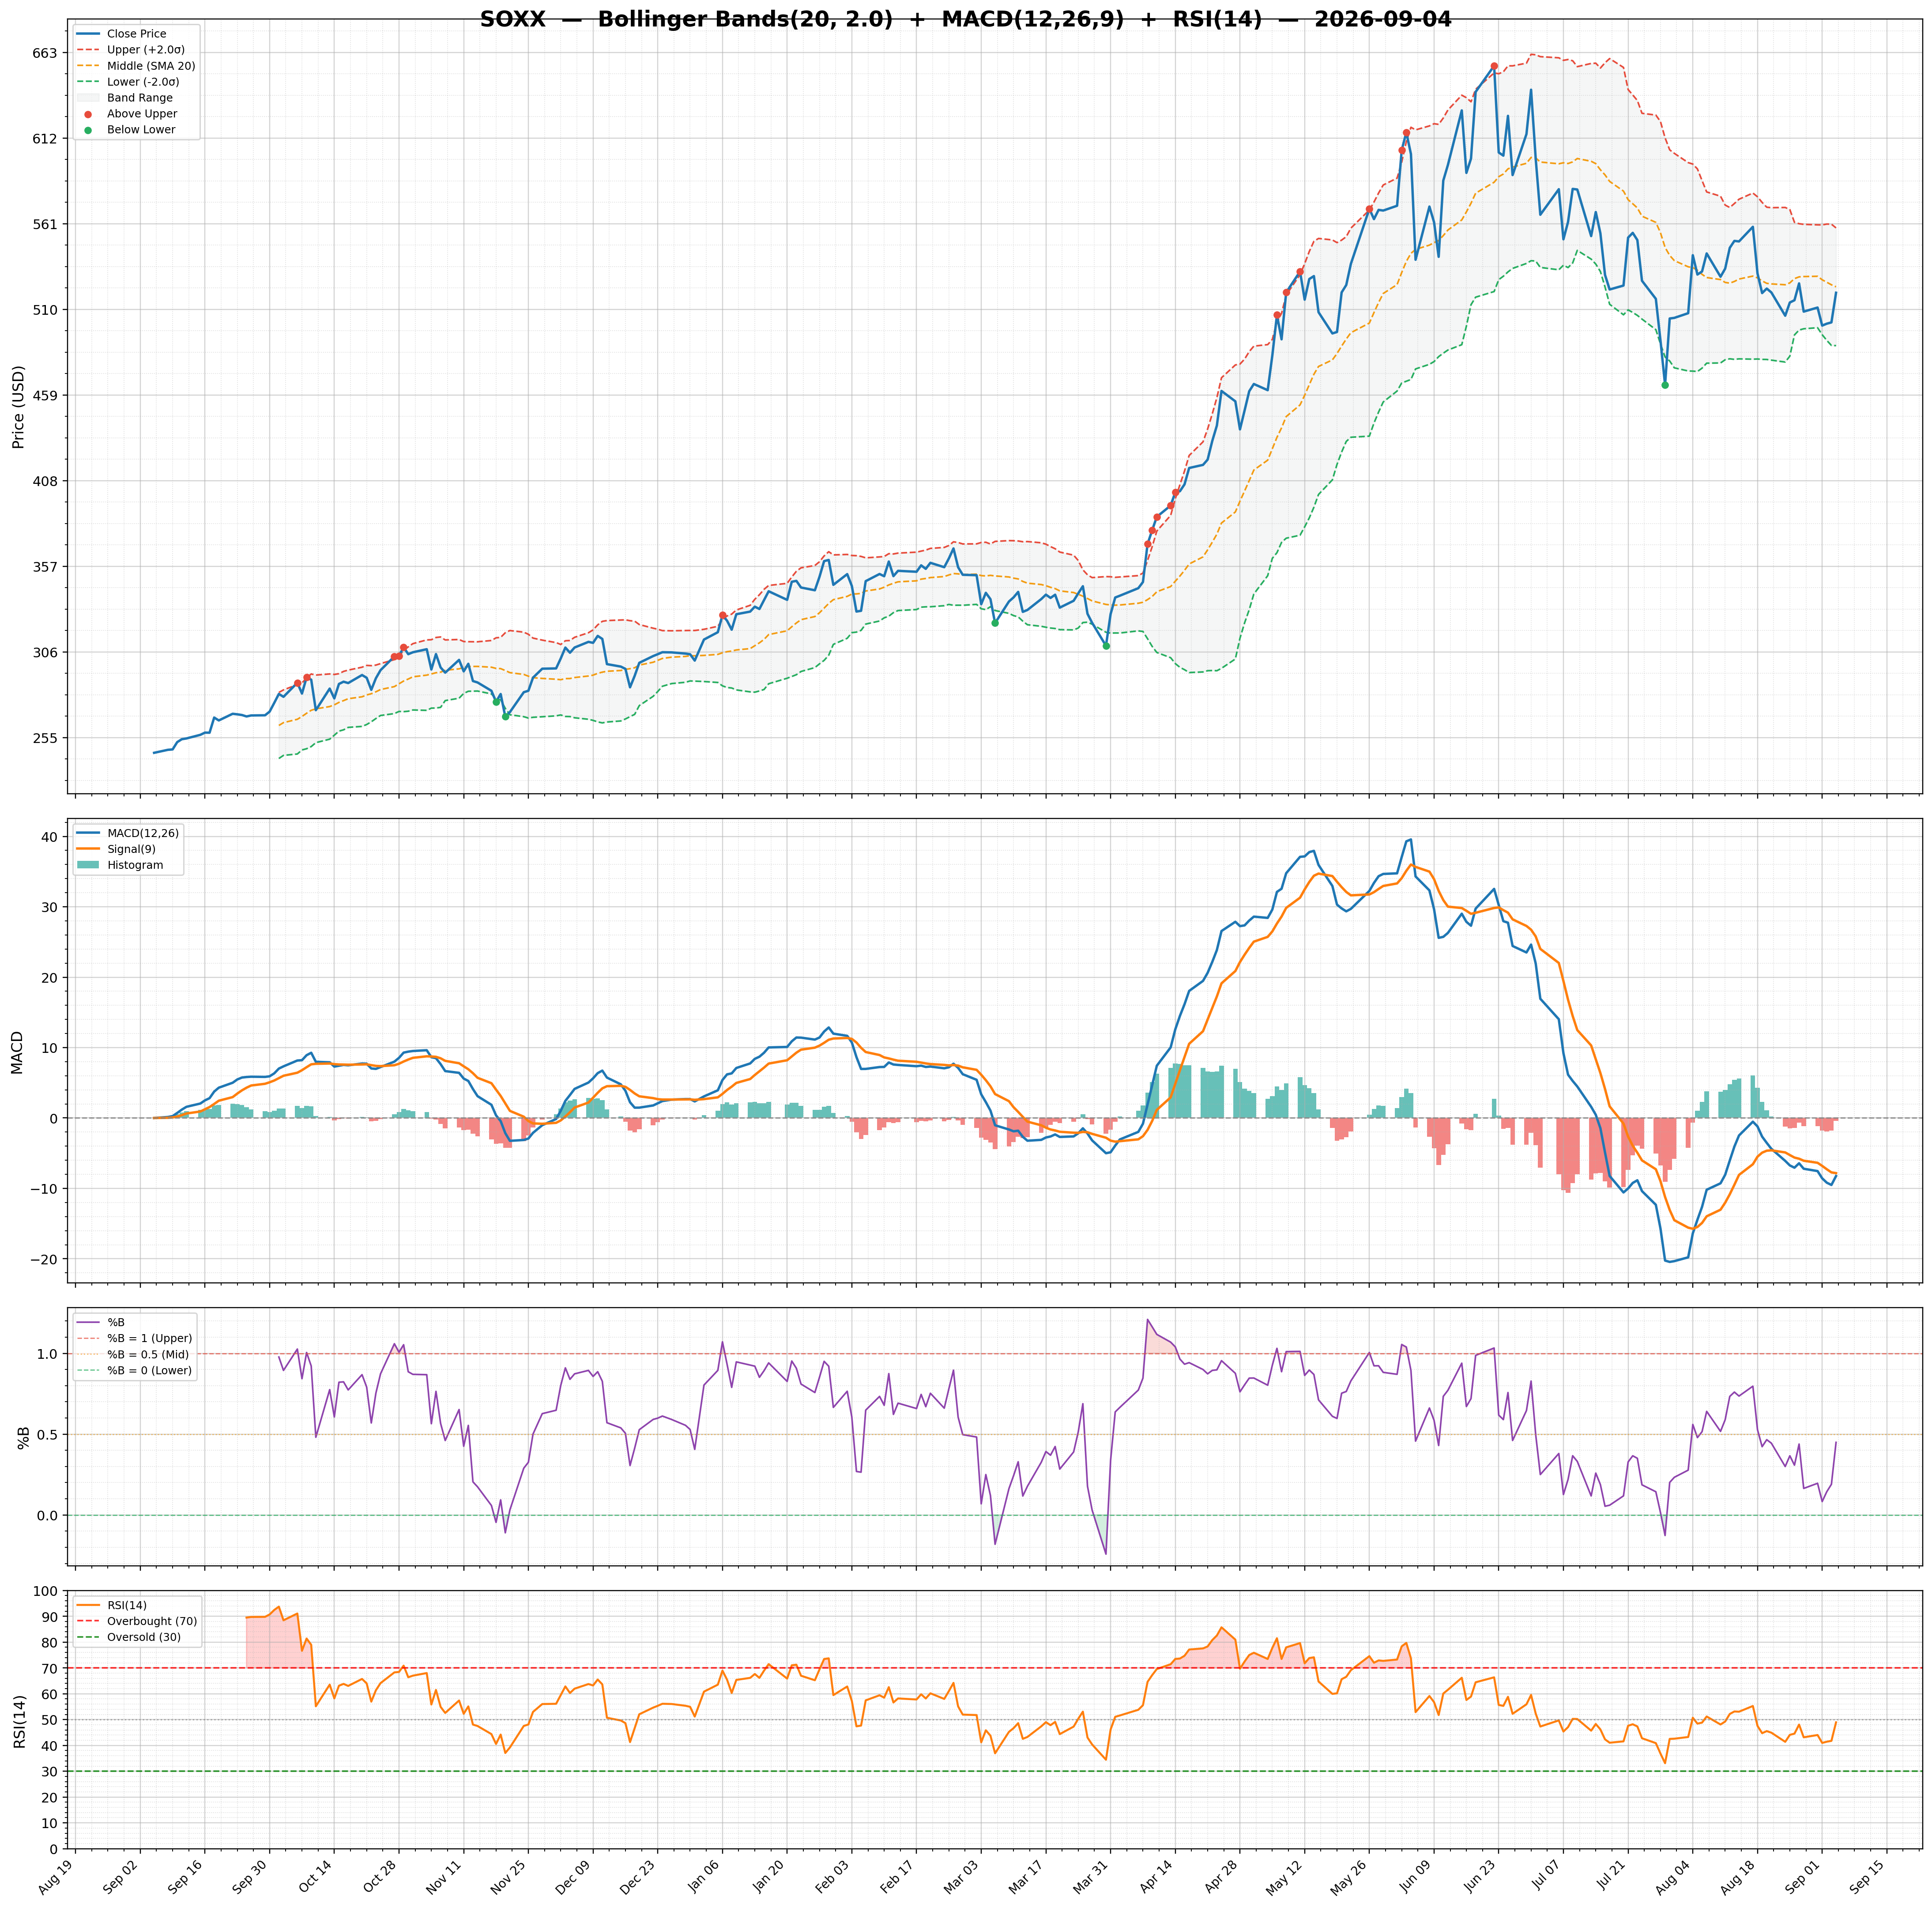
| Technical | Volume & Bollinger Bands | Analyst | |||
|---|---|---|---|---|---|
| RSI | 30.82 | Volume | 14.59M | Rating | |
| Previous RSI | 39.39 | Avg Volume 20D | 8.21M | Target Mean | N/A |
| RSI Trend | Down | Relative Volume | 1.85 | Target High | N/A |
| MACD | -13.55 | Lower Band | 473.62 | Target Low | N/A |
| MACD Signal | -4.09 | Middle Band | 546.17 | Target Median | N/A |
| Histogram | -9.46 | Upper Band | 618.73 | Analysts | N/A |
| Previous Histogram | -8.54 | Bandwidth | 26.570 | Upside | N/A |
| Histogram Trend | Decreasing | %B | 0.01 | ||