Space Exploration Technologies (SPCX)
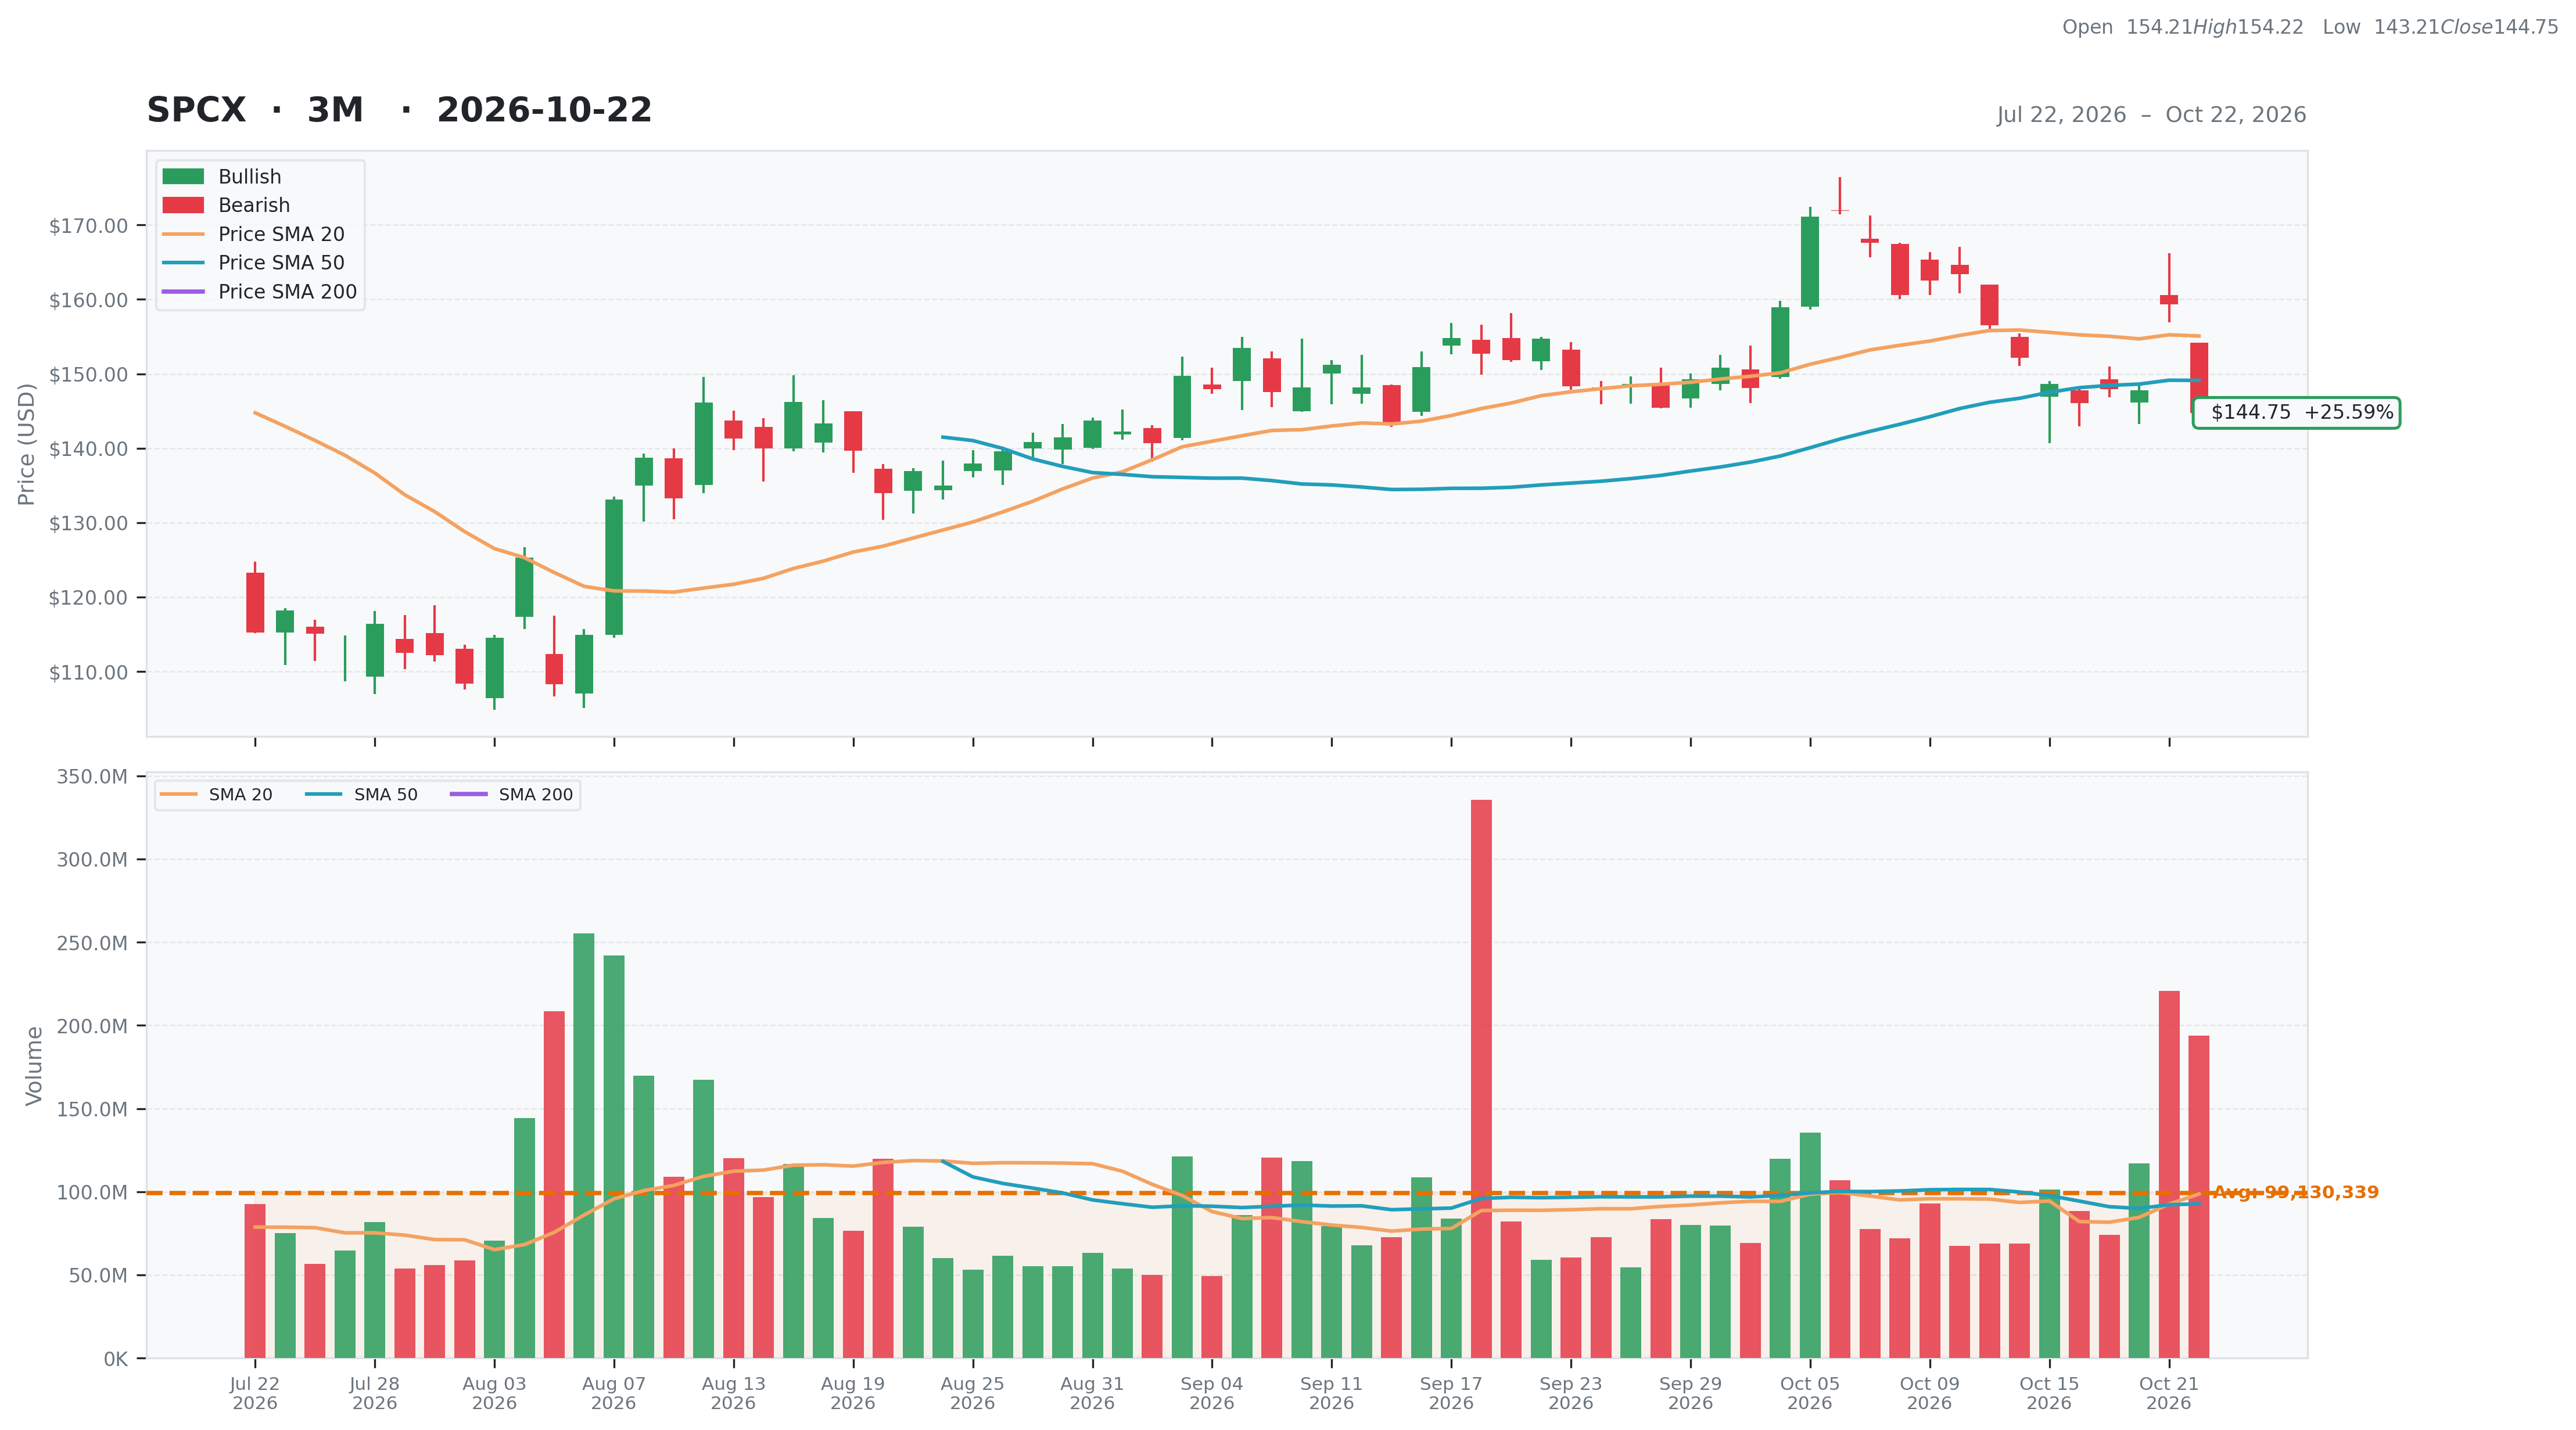
Industrials • Aerospace & Defense • $144.75 • MCap: 1,924,935,319,552
https://www.spacex.com • Space Exploration Technologies Corp. provides satellite-based broadband services in the United States, Ireland, Canada, and internationally. It operates through three operating segments: Space, Connectivity, and AI. The Space segment designs, manufactures, and launches reusable rockets to provide access to space. It also provides launch services for the deployment of payloads to intended orbits for commercial and government customers utilizing Falcon 9 and Falcon Heavy; and engages in the launch and development for the development of spacecraft and the provision of launch and mission services for government agency space programs utilizing Falcon 9, Falcon Heavy, Starship, and Dragon. Its company's Connectivity segment operates broadband data and communications network by various Starlink satellites in low-earth orbit, delivering connectivity to various consumers, enterprise, and government customers. The company's AI segment operates a vertically integrated AI platform spanning a frontier LLM Grok; AI solutions for consumer and enterprise customers; X, a real-time information, entertainment, and free speech platform; and AI computational infrastructure. Space Exploration Technologies Corp. was incorporated in 2002 and is based in Starbase, Texas.
Joie
| Score | Price | 52 Week & Averages | Relative Strength | Risk | |||||
|---|---|---|---|---|---|---|---|---|---|
| Total | 40 | Current | $144.75 | 52W High | $211.39 -31.52% | Relative Strength | N/A | Beta | N/A |
| Business Quality | 10 | Weekly | $148.62 -2.60% | 52W Low | $108.27 33.69% | 3M | N/A | Short % | 0.03 |
| Financial Strength | 13 | Monthly | $154.72 -6.44% | Above 50DMA | $149.12 -2.93% | 6M | N/A | Risk Score | |
| Growth Outlook | 1 | Quarterly | $115.07 25.79% | Above 200DMA | N/A N/A | 9M | N/A | ||
| Momentum | 3 | Yearly | N/A N/A | 12M | N/A | ||||
| Valuation | Financial Strength | Growth/Profitability | |||
|---|---|---|---|---|---|
| Trailing P/E | N/A | Cash | 100,009M | Revenue Growth | 0.92% |
| Forward P/E | 73.46 | Debt | 39,708M | Earnings Growth | N/A |
| PEG Ratio | N/A | Debt/Equity | 31.21 | Qtr Earnings Growth | N/A |
| Price/Sales | 83.53 | Current Ratio | 5.12 | Gross Margin | 0.52% |
| Price/Book | 15.12 | Quick Ratio | 4.95 | Operating Margin | -0.02% |
| EV/Revenue | 164.45 | Operating CF | 9,900M | Profit Margin | -0.36% |
| EV/EBITDA | 642.63 | Free CF | N/A | EBITDA Margin | 0.26% |
| Ent Value | 3,789,570M | Return on Assets | N/A | ||
| Return on Equity | N/A | ||||
| Technical | Volume & Bollinger Bands | Analyst | |||
|---|---|---|---|---|---|
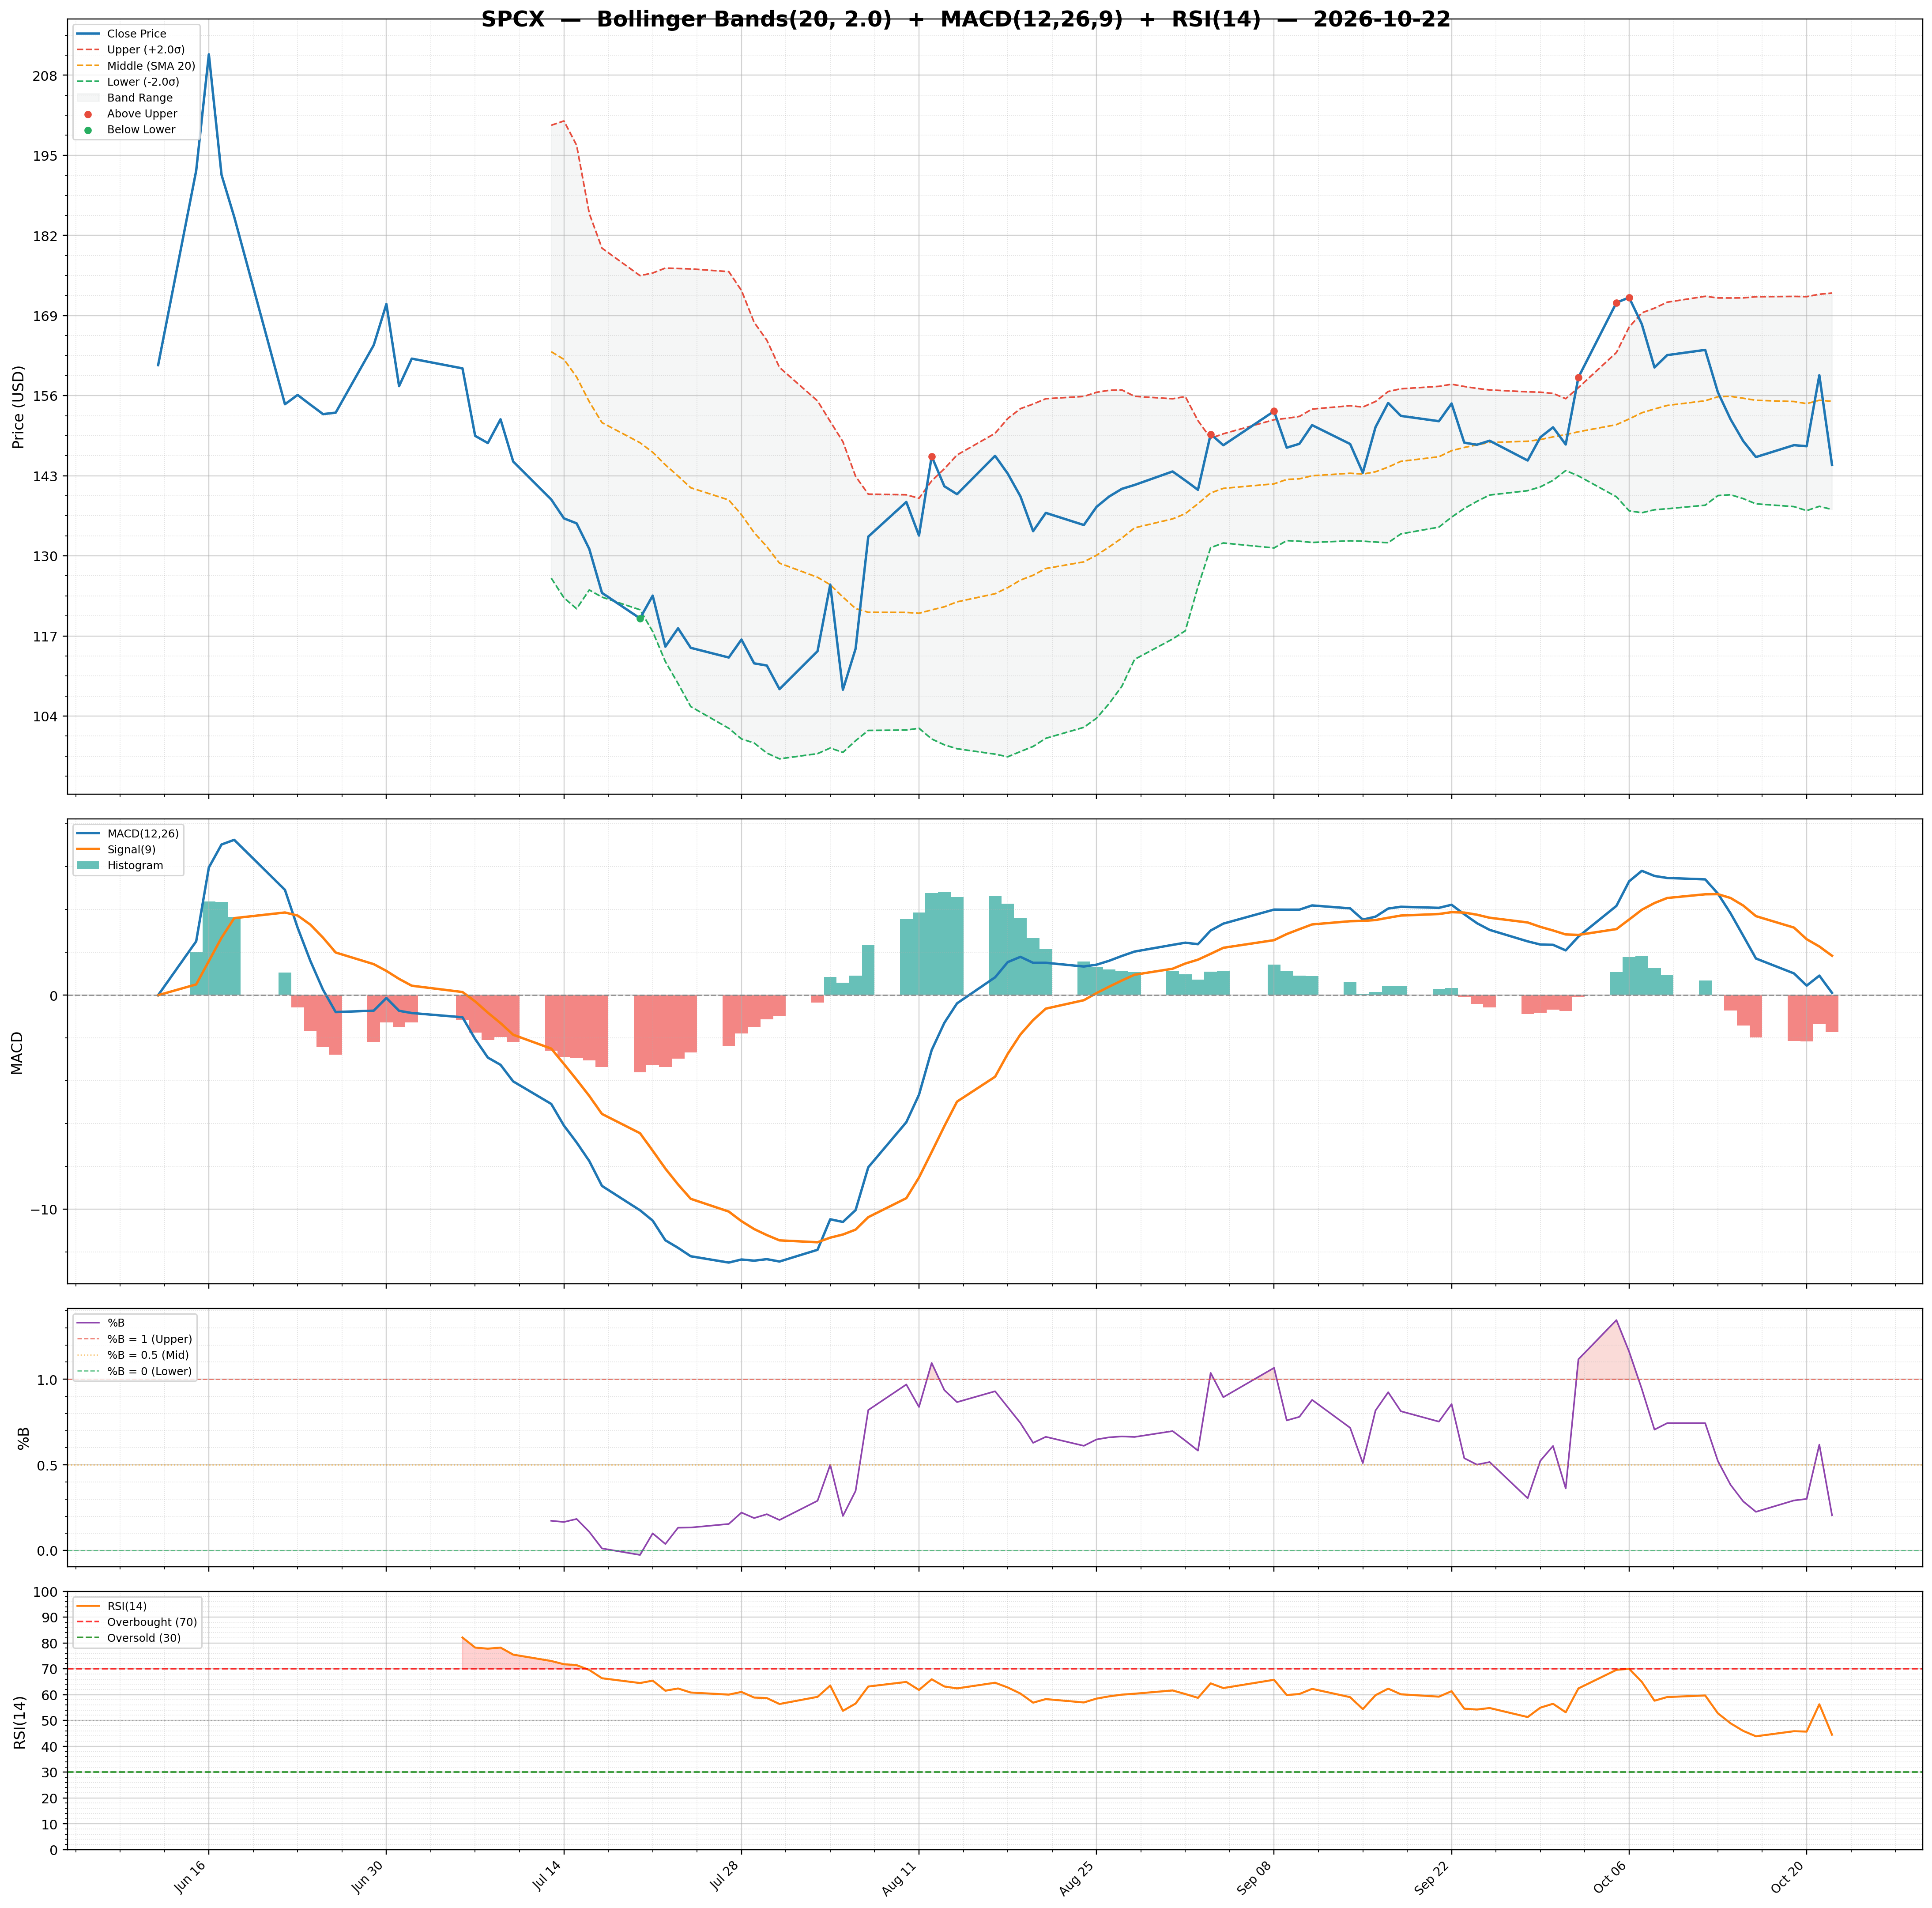
| RSI | 44.48 | Volume | 87.72M | Rating | buy |
| Previous RSI | 56.26 | Avg Volume 20D | 98.63M | Target Mean | $222.71 |
| RSI Trend | Down | Relative Volume | 1.94 | Target High | $450.00 |
| MACD | 0.06 | Lower Band | 137.52 | Target Low | $118.00 |
| MACD Signal | 1.77 | Middle Band | 155.08 | Target Median | $225.00 |
| Histogram | -1.71 | Upper Band | 172.64 | Analysts | 31 |
| Previous Histogram | -1.34 | Bandwidth | 22.650 | Upside | 52.51% |
| Histogram Trend | Decreasing | %B | 0.21 | ||