SPS Commerce, Inc. (SPSC)
Technology • Software - Application • $91.94 • MCap: 3,069,015,040
https://www.spscommerce.com • SPS Commerce, Inc. provides cloud-based supply chain management solutions in the United States. It offers solutions through SPS Commerce, a cloud-based platform that connects retailers, brands, distributors, manufacturers, and logistics providers, handling the complexity of modern commerce operations. The company also provides Fulfillment, a comprehensive solution designed to streamline supply chain operation that sends and receives order data, ensuring accurate execution of required processes from order to invoicing and revenue recovery through fully automated operations; and Analytics product that simplifies managing sell-through data from customers business partners that handle data acquisition, cleansing, normalization, and delivery. In addition, it offers various complimentary products, such as assortment product, which simplifies the communication of robust, accurate item data by automatically translating item attributes, and hierarchies through single connection across all sales channels; and relationship management product that allows organizations to accelerate digitization of their supply chain and improve collaboration with suppliers through change management, onboarding programs, and supplier score carding. The company was formerly known as St. Paul Software, Inc. and changed its name to SPS Commerce, Inc. in May 2001. SPS Commerce, Inc. was incorporated in 1987 and is headquartered in Minneapolis, Minnesota.
ET
| Score | Price | 52 Week & Averages | Relative Strength | Risk | |||||
|---|---|---|---|---|---|---|---|---|---|
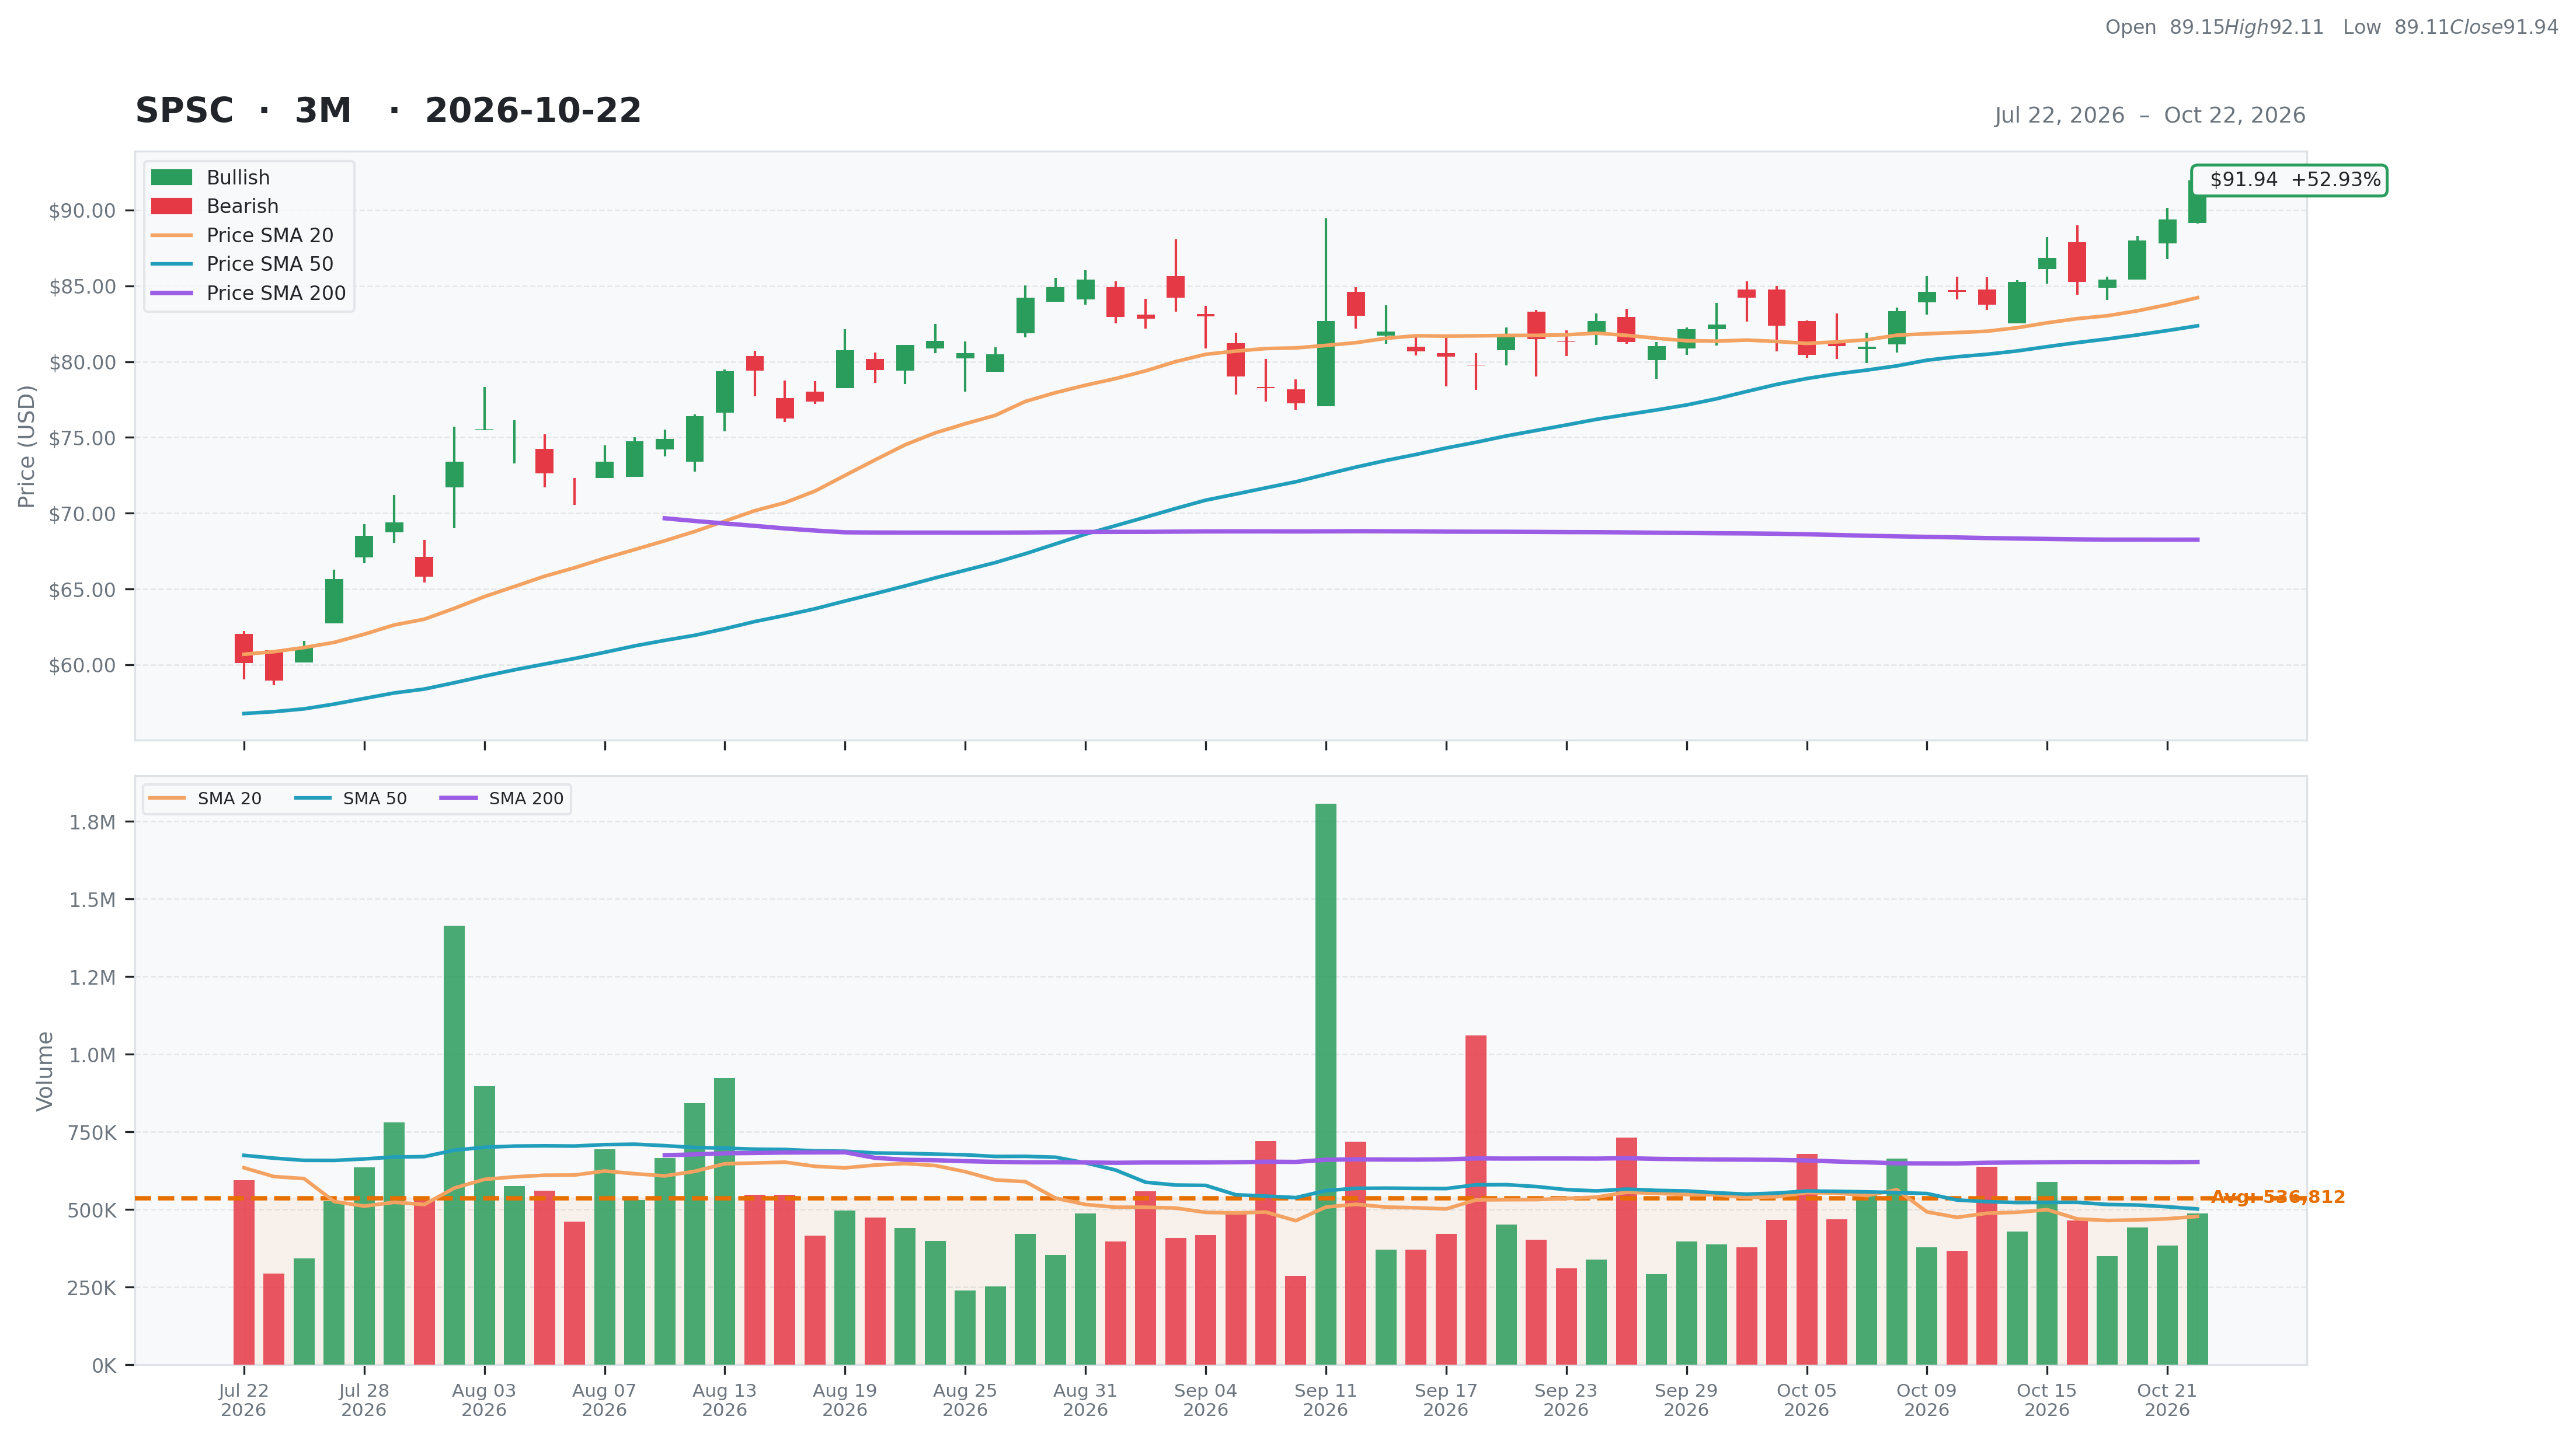
| Total | 55 | Current | $91.94 | 52W High | $112.45 -18.24% | Relative Strength | 0.31 | Beta | 0.62 |
| Business Quality | 20 | Weekly | $86.82 5.90% | 52W Low | $49.91 84.21% | 3M | 0.50 | Short % | 0.09 |
| Financial Strength | 15 | Monthly | $81.48 12.84% | Above 50DMA | $82.36 11.64% | 6M | 0.72 | Risk Score | 1 |
| Growth Outlook | 4 | Quarterly | $61.16 50.33% | Above 200DMA | $68.26 34.70% | 9M | 0.00 | ||
| Momentum | 3 | Yearly | $111.00 -17.17% | 12M | -0.18 | ||||
| Valuation | Financial Strength | Growth/Profitability | |||
|---|---|---|---|---|---|
| Trailing P/E | 41.18 | Cash | 173M | Revenue Growth | 0.06% |
| Forward P/E | 16.01 | Debt | 6M | Earnings Growth | -0.64% |
| PEG Ratio | 4.55 | Debt/Equity | 0.67 | Qtr Earnings Growth | -0.65% |
| Price/Sales | 3.97 | Current Ratio | 2.26 | Gross Margin | 0.70% |
| Price/Book | 3.29 | Quick Ratio | 1.62 | Operating Margin | 0.16% |
| EV/Revenue | 3.76 | Operating CF | 228M | Profit Margin | 0.10% |
| EV/EBITDA | 15.83 | Free CF | 177M | EBITDA Margin | 0.24% |
| Ent Value | 2,901M | Return on Assets | 0.07% | ||
| Return on Equity | 0.08% | ||||
| Technical | Volume & Bollinger Bands | Analyst | |||
|---|---|---|---|---|---|
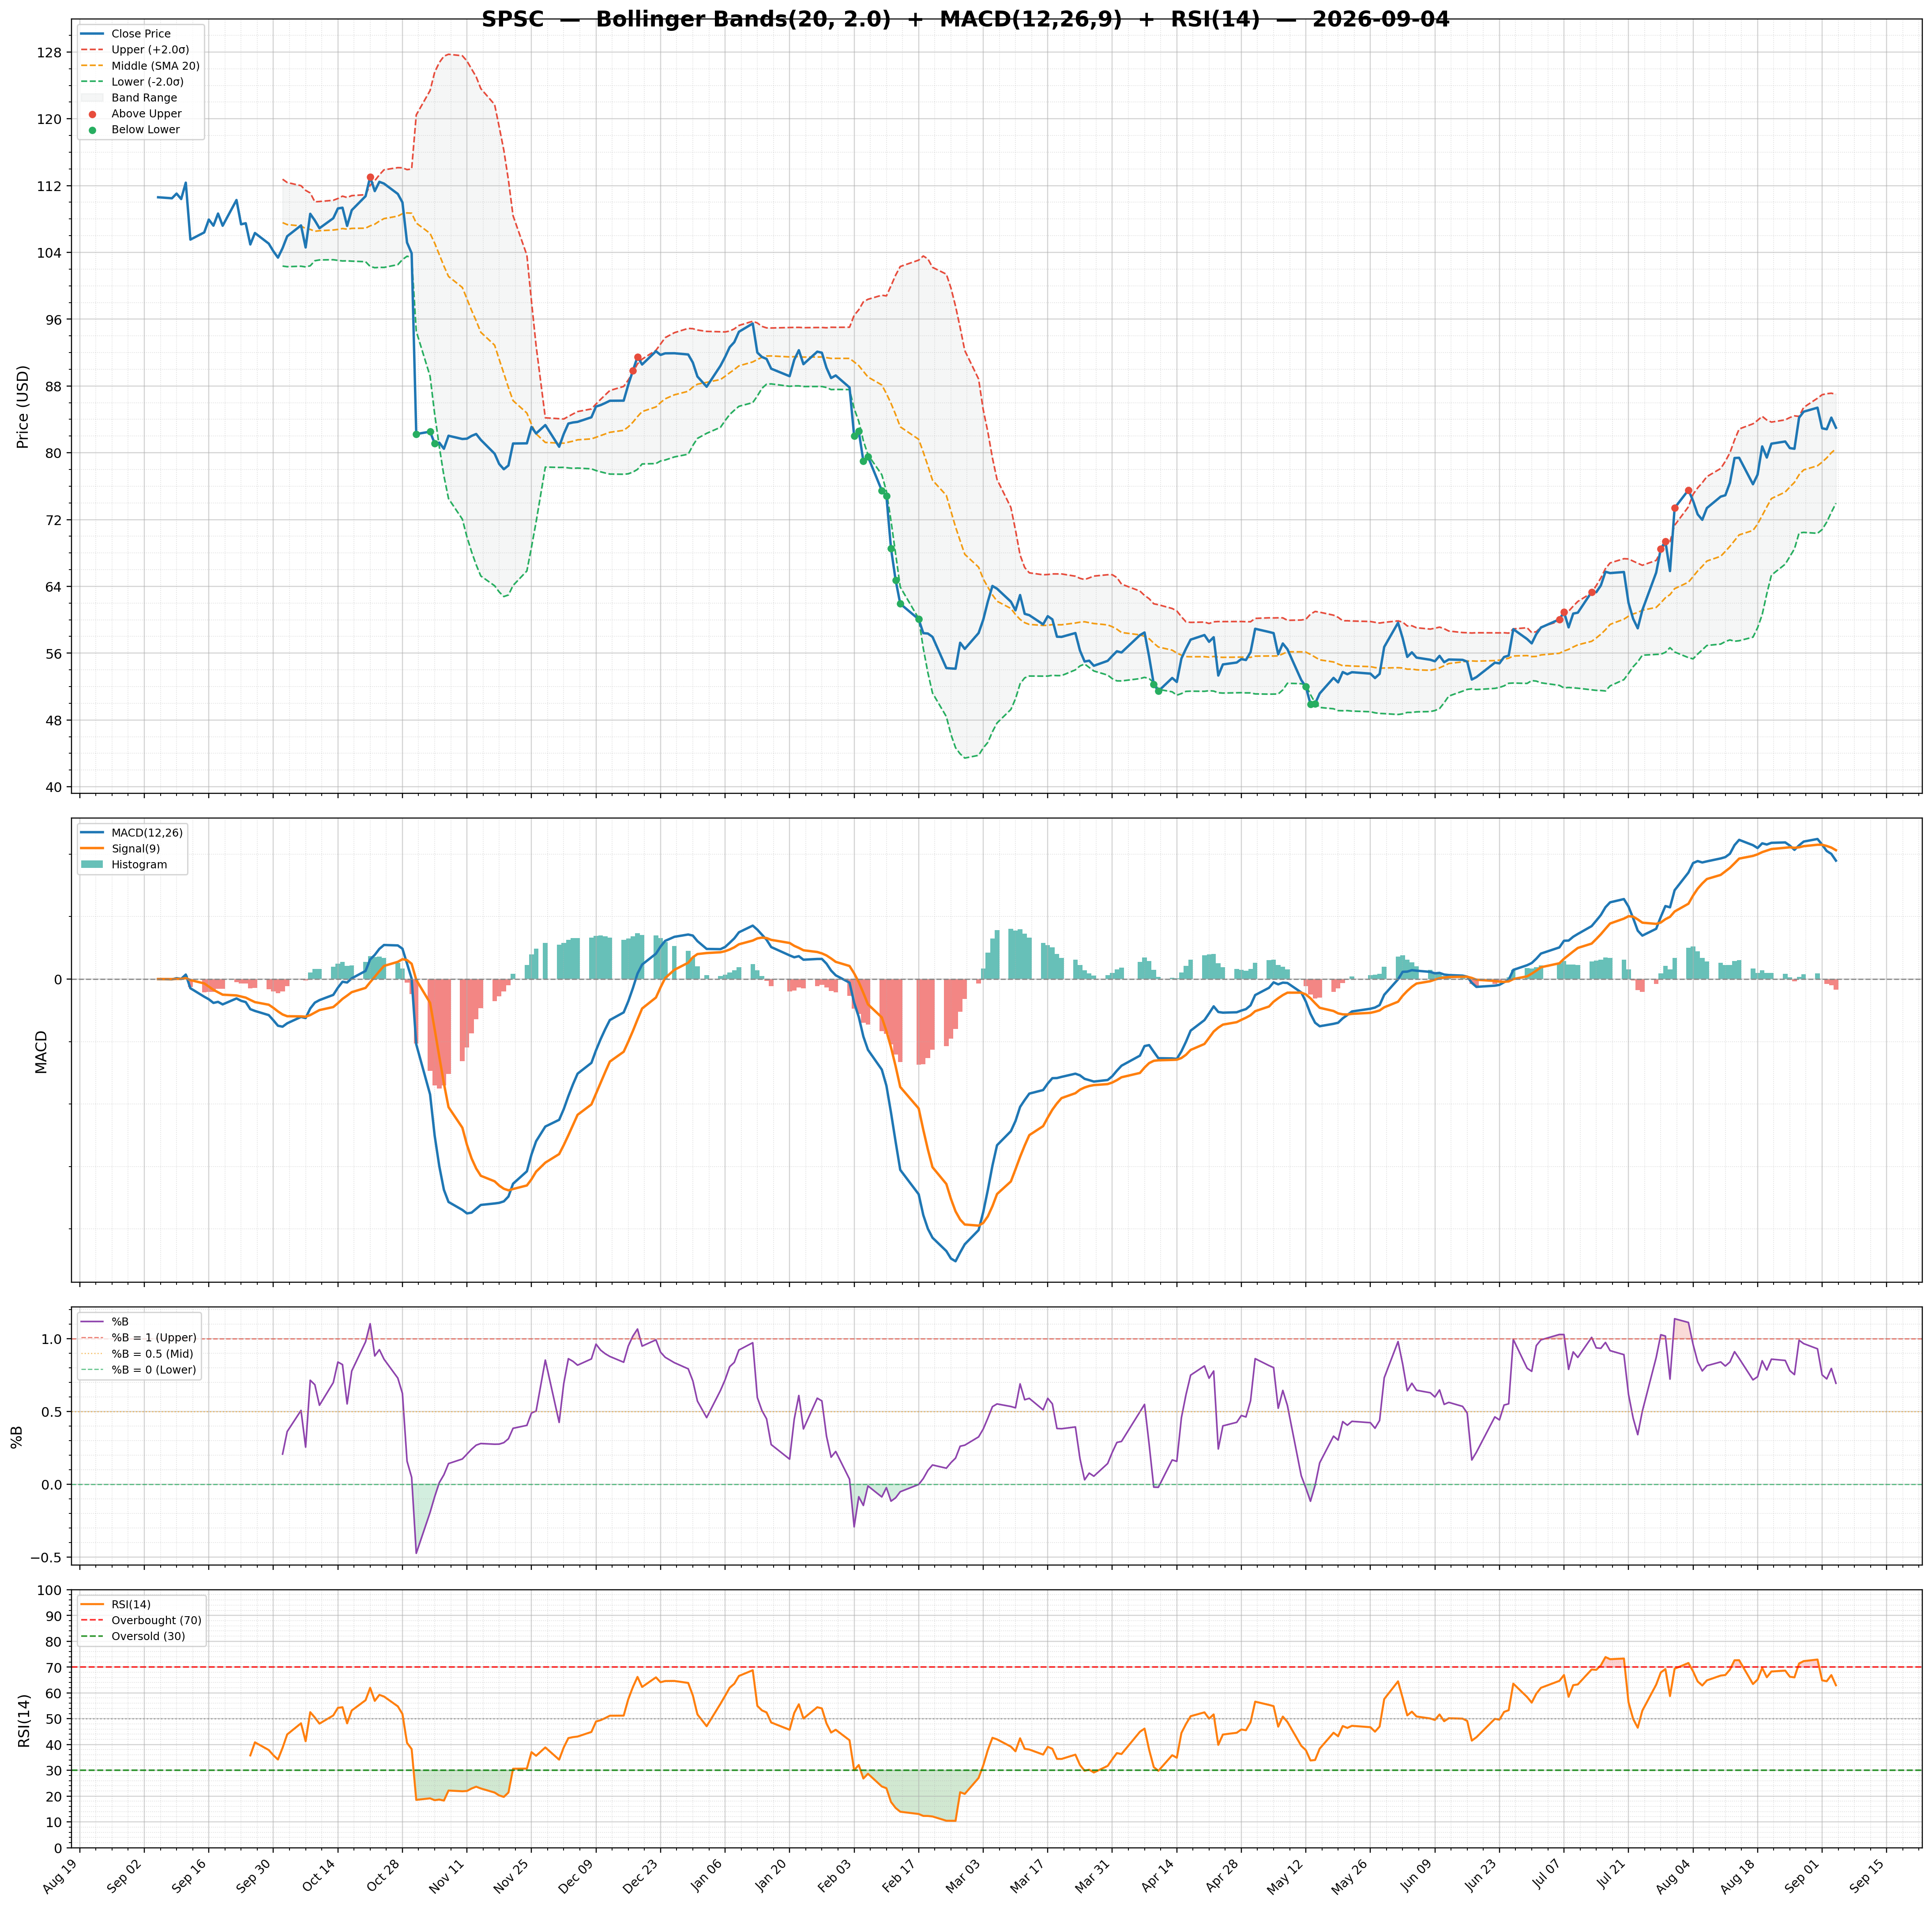
| RSI | 72.29 | Volume | 0.47M | Rating | hold |
| Previous RSI | 67.96 | Avg Volume 20D | 0.48M | Target Mean | $76.82 |
| RSI Trend | Up | Relative Volume | 0.93 | Target High | $103.00 |
| MACD | 2.24 | Lower Band | 78.12 | Target Low | $59.00 |
| MACD Signal | 1.58 | Middle Band | 84.21 | Target Median | $70.00 |
| Histogram | 0.66 | Upper Band | 90.31 | Analysts | 11 |
| Previous Histogram | 0.45 | Bandwidth | 14.480 | Upside | -9.89% |
| Histogram Trend | Increasing | %B | 1.13 | ||