State Street SPDR S&P 500 ETF T (SPY)
• • $763.96 • MCap:
• The trust seeks to achieve its investment objective by holding a portfolio of the common stocks that are included in the index (the “Portfolio”), with the weight of each stock in the Portfolio substantially corresponding to the weight of such stock in the index.
Sector
| Score | Price | 52 Week & Averages | Relative Strength | Risk | |||||
|---|---|---|---|---|---|---|---|---|---|
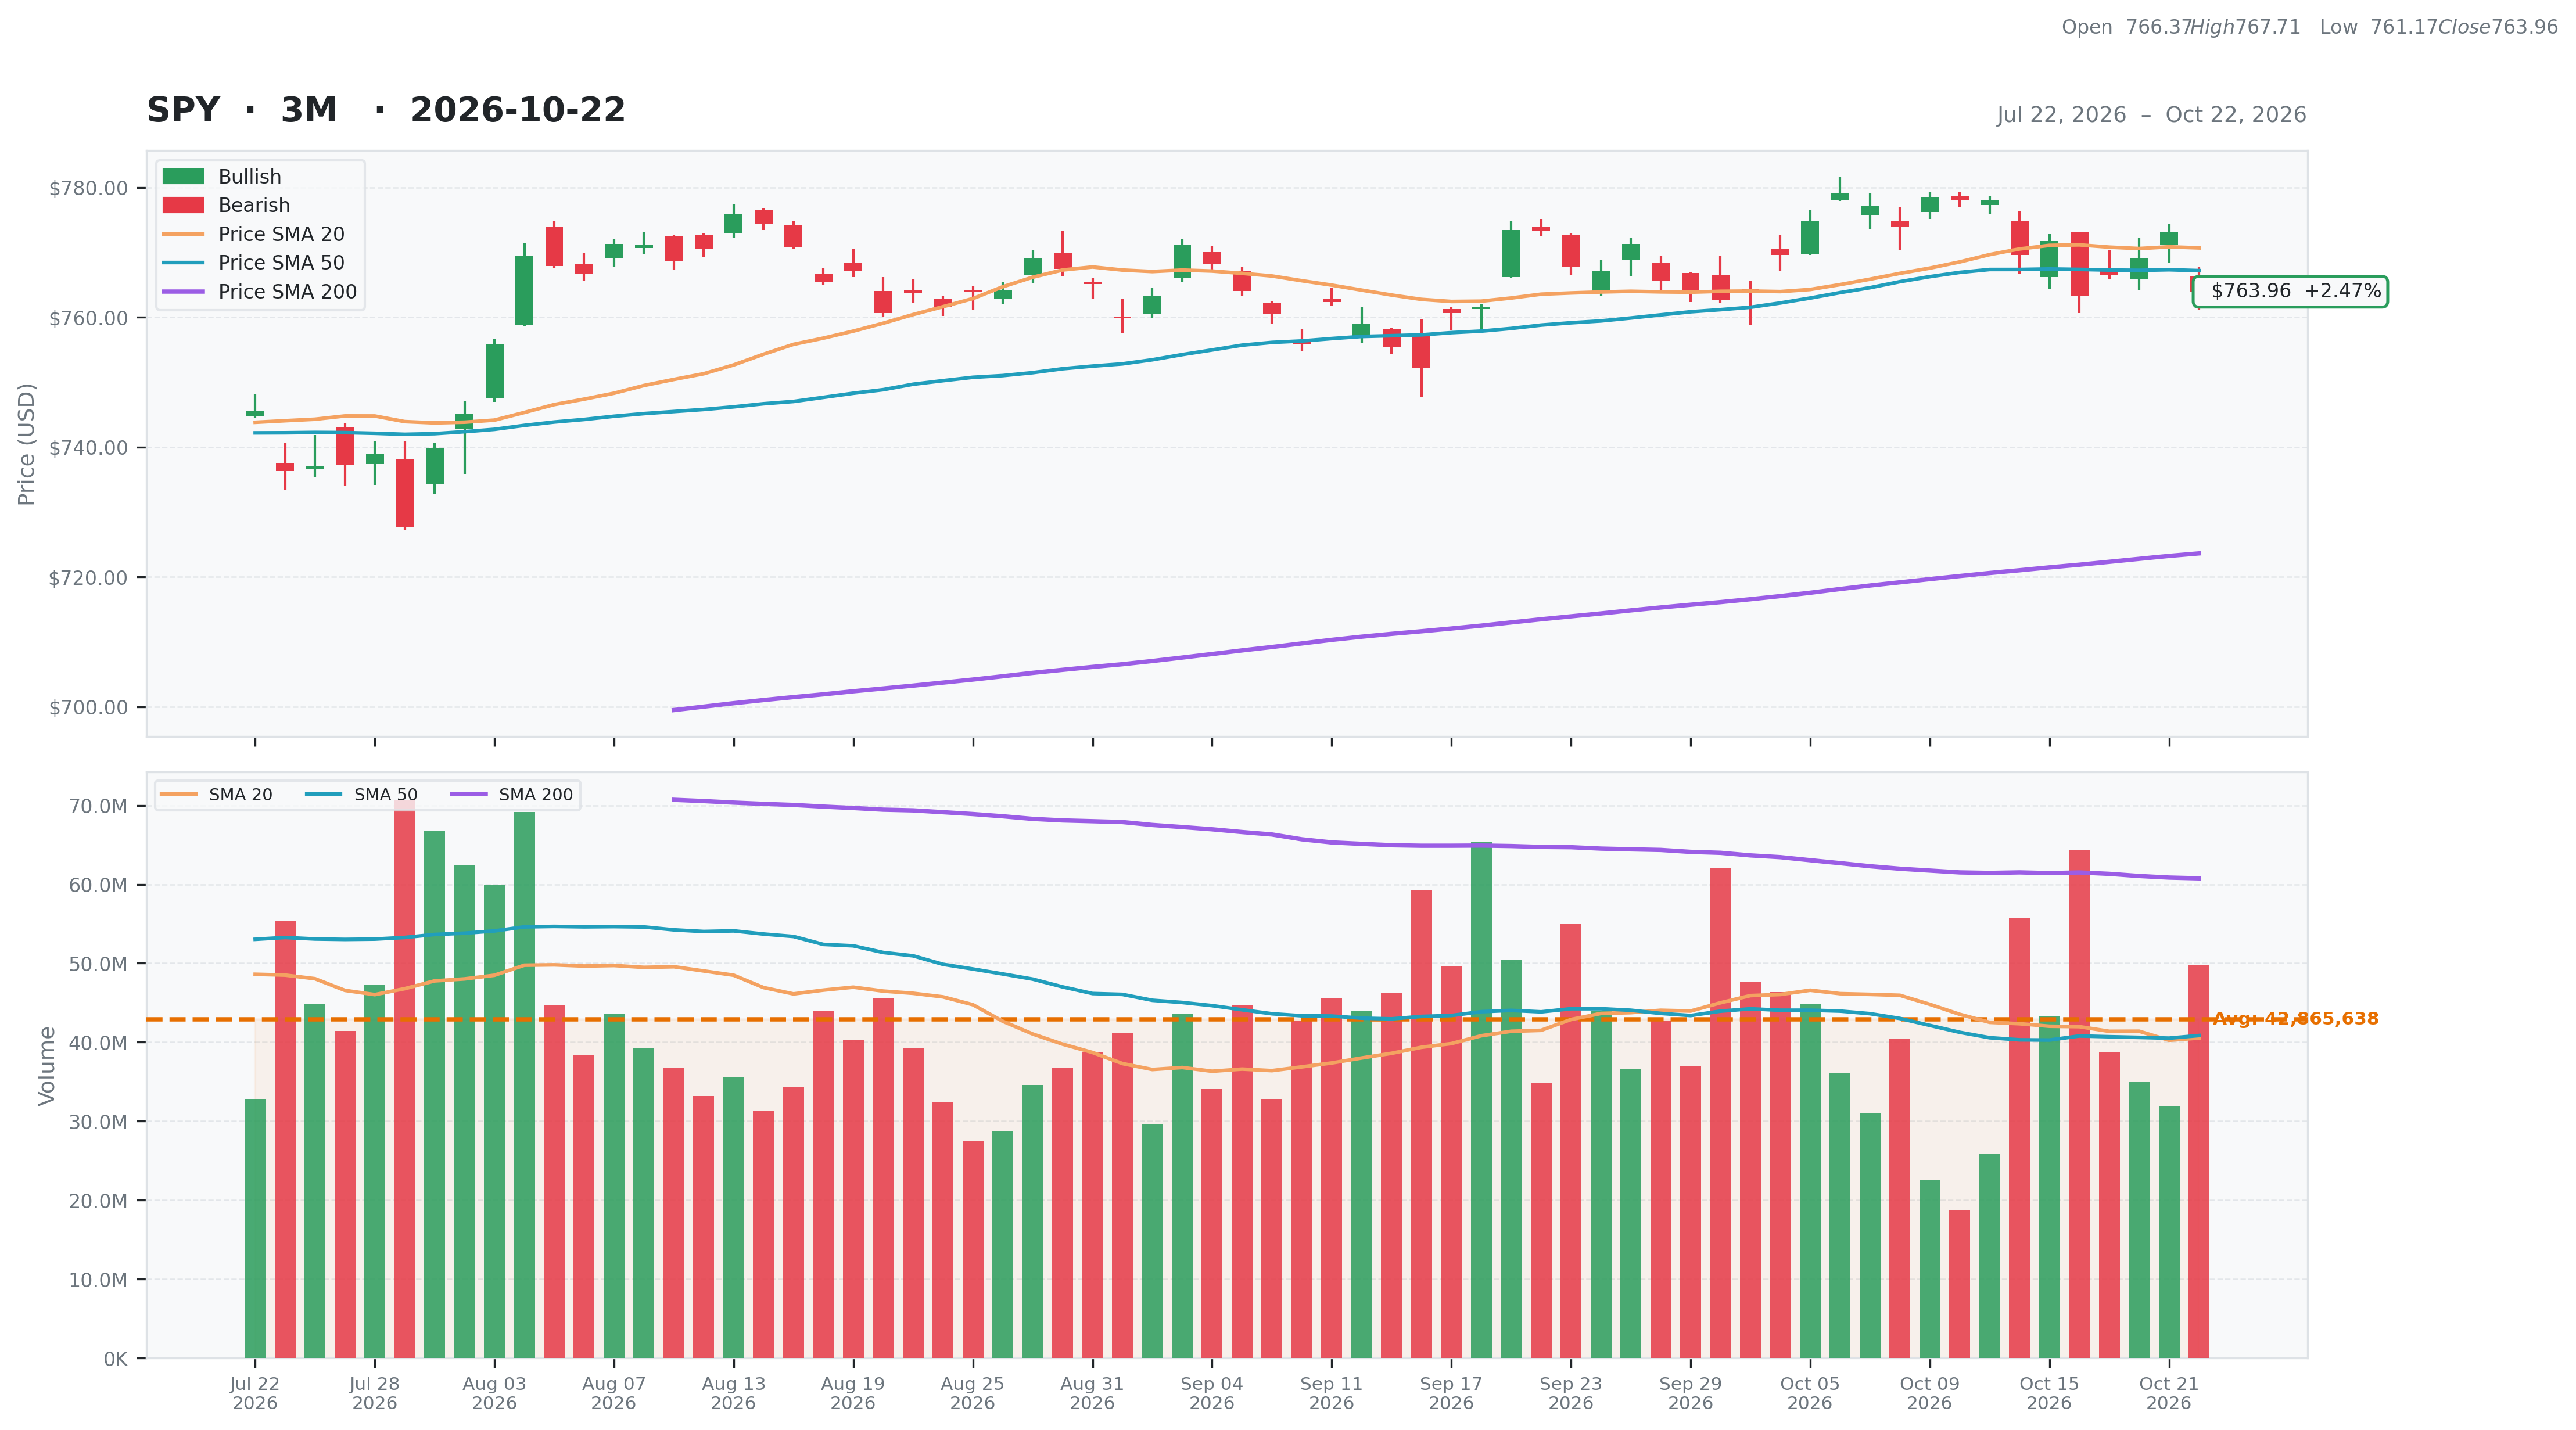
| Total | 29 | Current | $763.96 | 52W High | $779.09 -1.94% | Relative Strength | 0.08 | Beta | N/A |
| Business Quality | 1 | Weekly | $771.79 -1.01% | 52W Low | $628.78 21.50% | 3M | 0.04 | Short % | |
| Financial Strength | 6 | Monthly | $773.38 -1.22% | Above 50DMA | $767.22 -0.42% | 6M | 0.08 | Risk Score | |
| Growth Outlook | 1 | Quarterly | $737.10 3.64% | Above 200DMA | $723.62 5.57% | 9M | 0.12 | ||
| Momentum | 3 | Yearly | $677.93 12.69% | 12M | 0.14 | ||||
| Valuation | Financial Strength | Growth/Profitability | |||
|---|---|---|---|---|---|
| Trailing P/E | 24.23 | Cash | N/A | Revenue Growth | N/A |
| Forward P/E | N/A | Debt | N/A | Earnings Growth | N/A |
| PEG Ratio | N/A | Debt/Equity | N/A | Qtr Earnings Growth | N/A |
| Price/Sales | N/A | Current Ratio | N/A | Gross Margin | N/A |
| Price/Book | 1.78 | Quick Ratio | N/A | Operating Margin | N/A |
| EV/Revenue | N/A | Operating CF | N/A | Profit Margin | N/A |
| EV/EBITDA | N/A | Free CF | N/A | EBITDA Margin | N/A |
| Ent Value | N/A | Return on Assets | N/A | ||
| Return on Equity | N/A | ||||
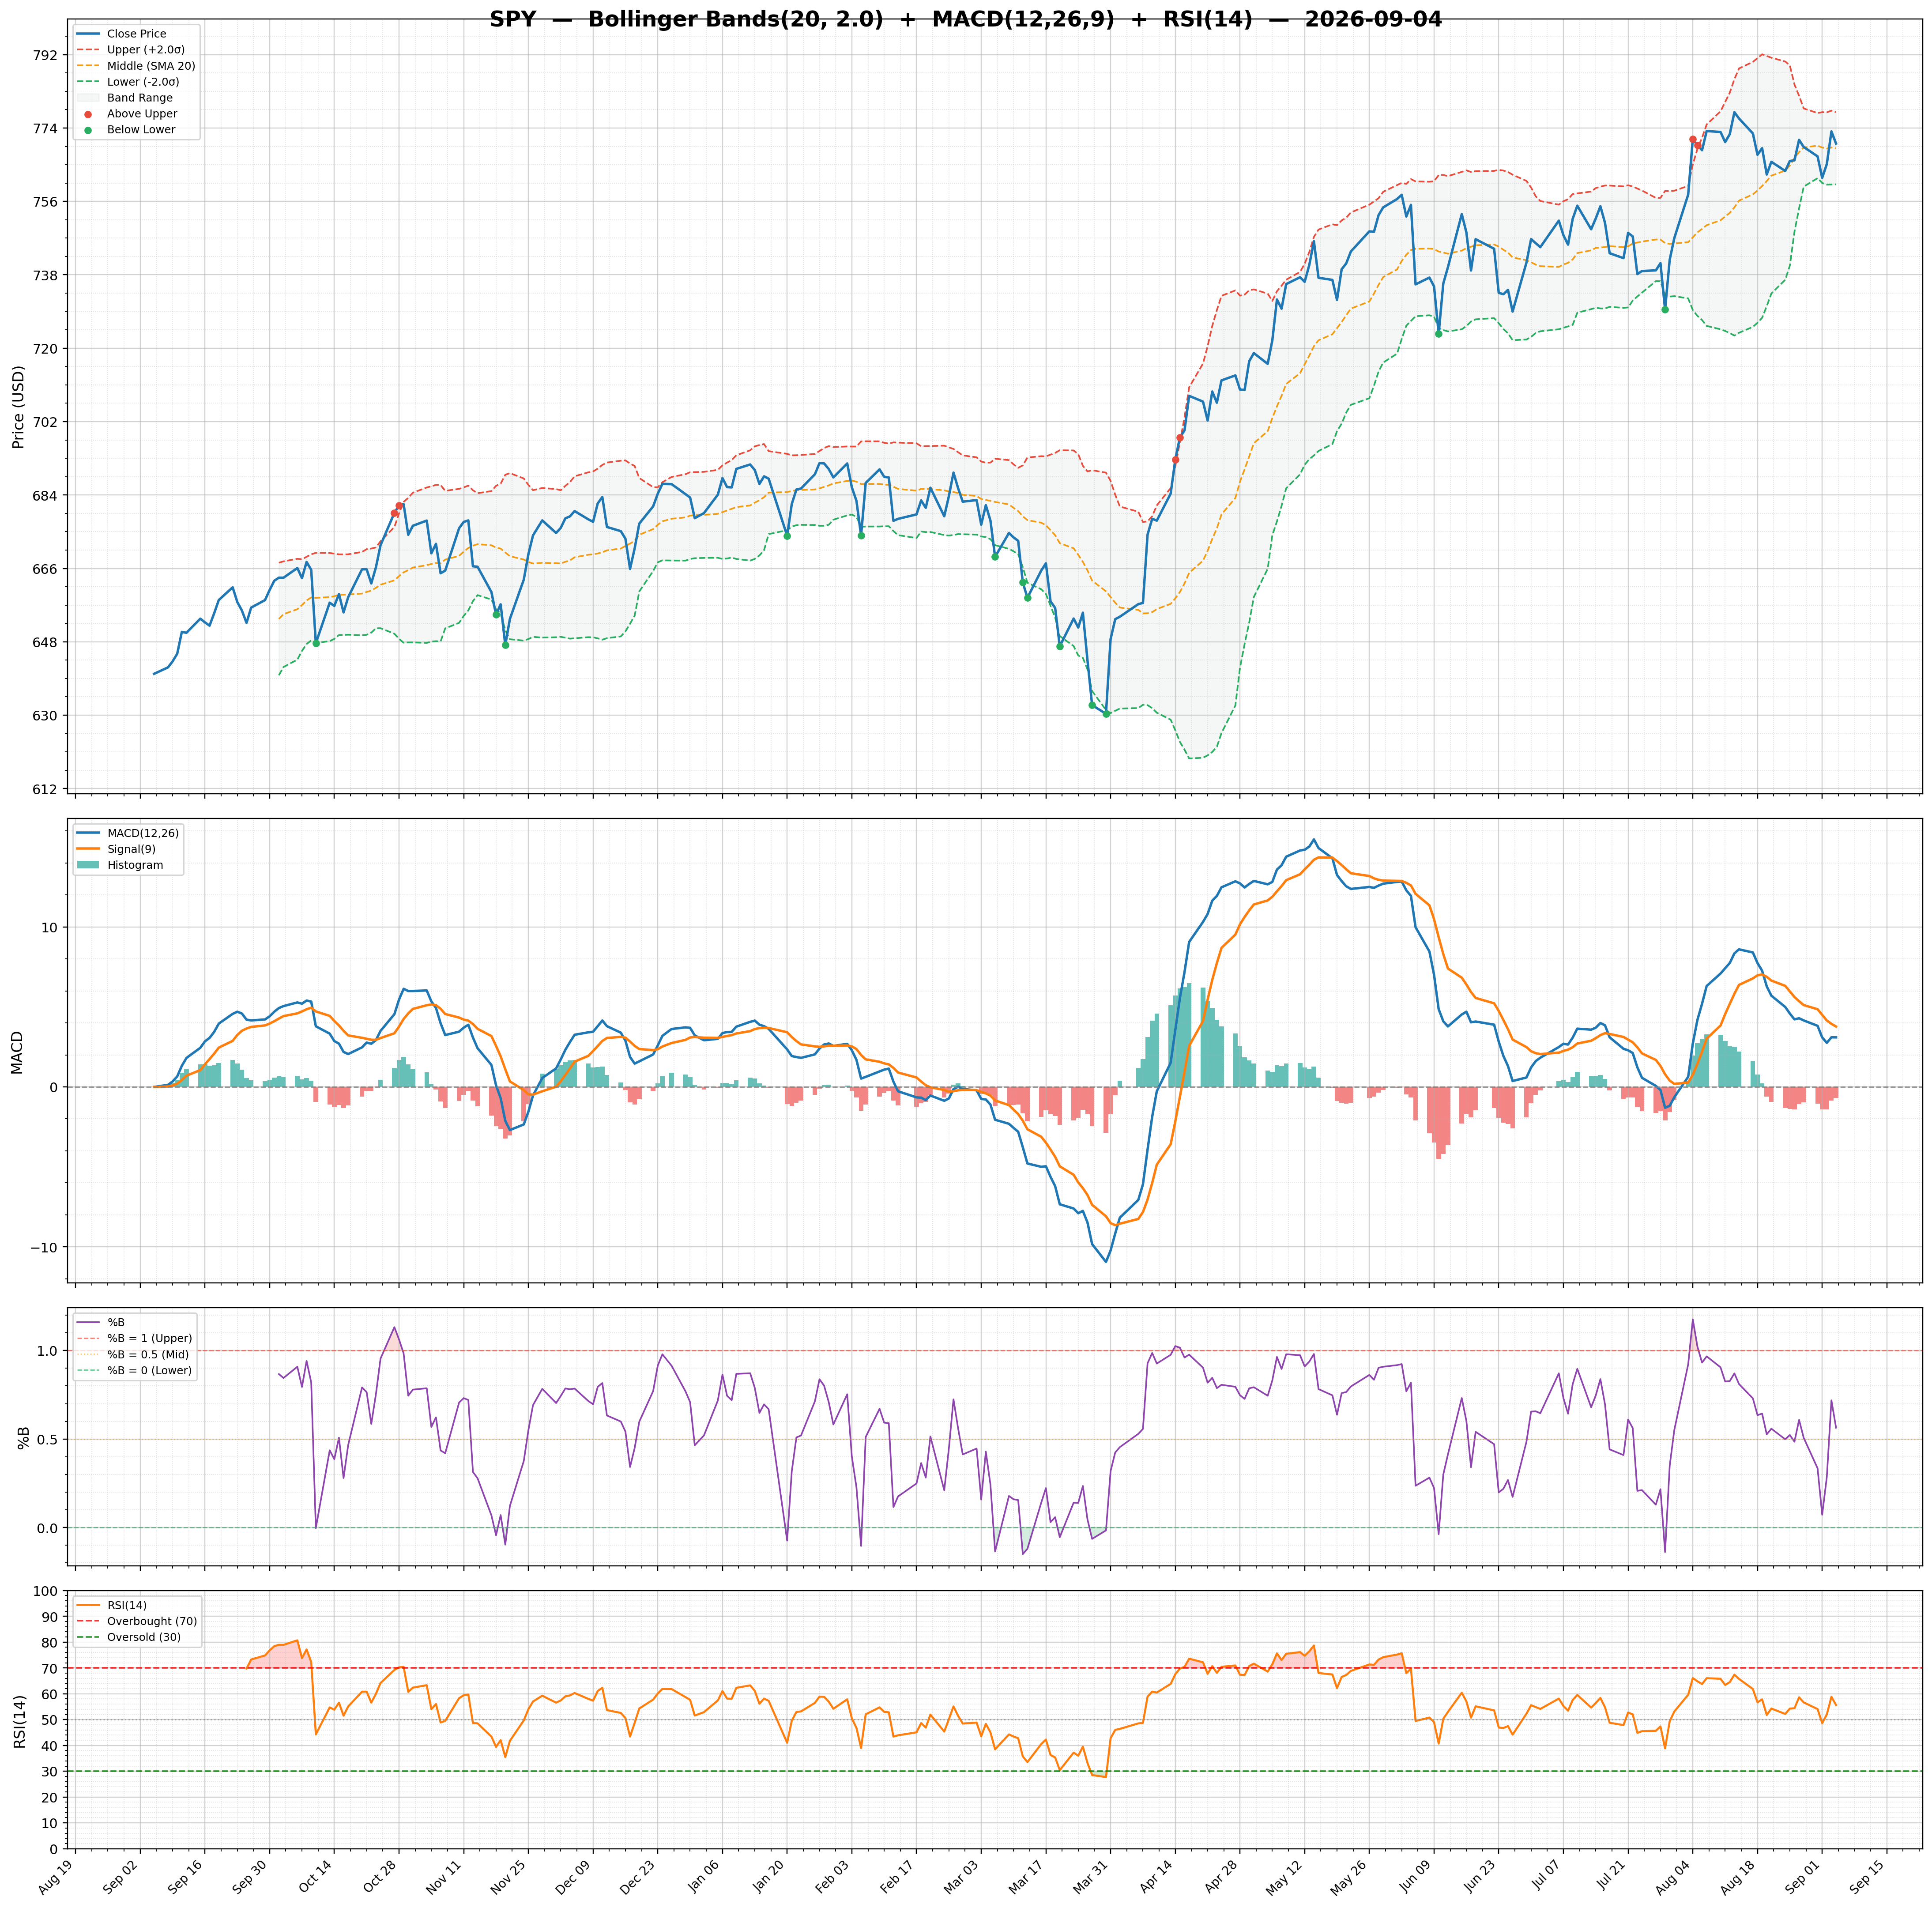
| Technical | Volume & Bollinger Bands | Analyst | |||
|---|---|---|---|---|---|
| RSI | 45.44 | Volume | 63.54M | Rating | |
| Previous RSI | 53.81 | Avg Volume 20D | 40.53M | Target Mean | N/A |
| RSI Trend | Down | Relative Volume | 1.14 | Target High | N/A |
| MACD | 0.72 | Lower Band | 759.30 | Target Low | N/A |
| MACD Signal | 1.86 | Middle Band | 770.72 | Target Median | N/A |
| Histogram | -1.14 | Upper Band | 782.14 | Analysts | N/A |
| Previous Histogram | -0.77 | Bandwidth | 2.960 | Upside | N/A |
| Histogram Trend | Decreasing | %B | 0.20 | ||