Sterling Infrastructure, Inc. (STRL)
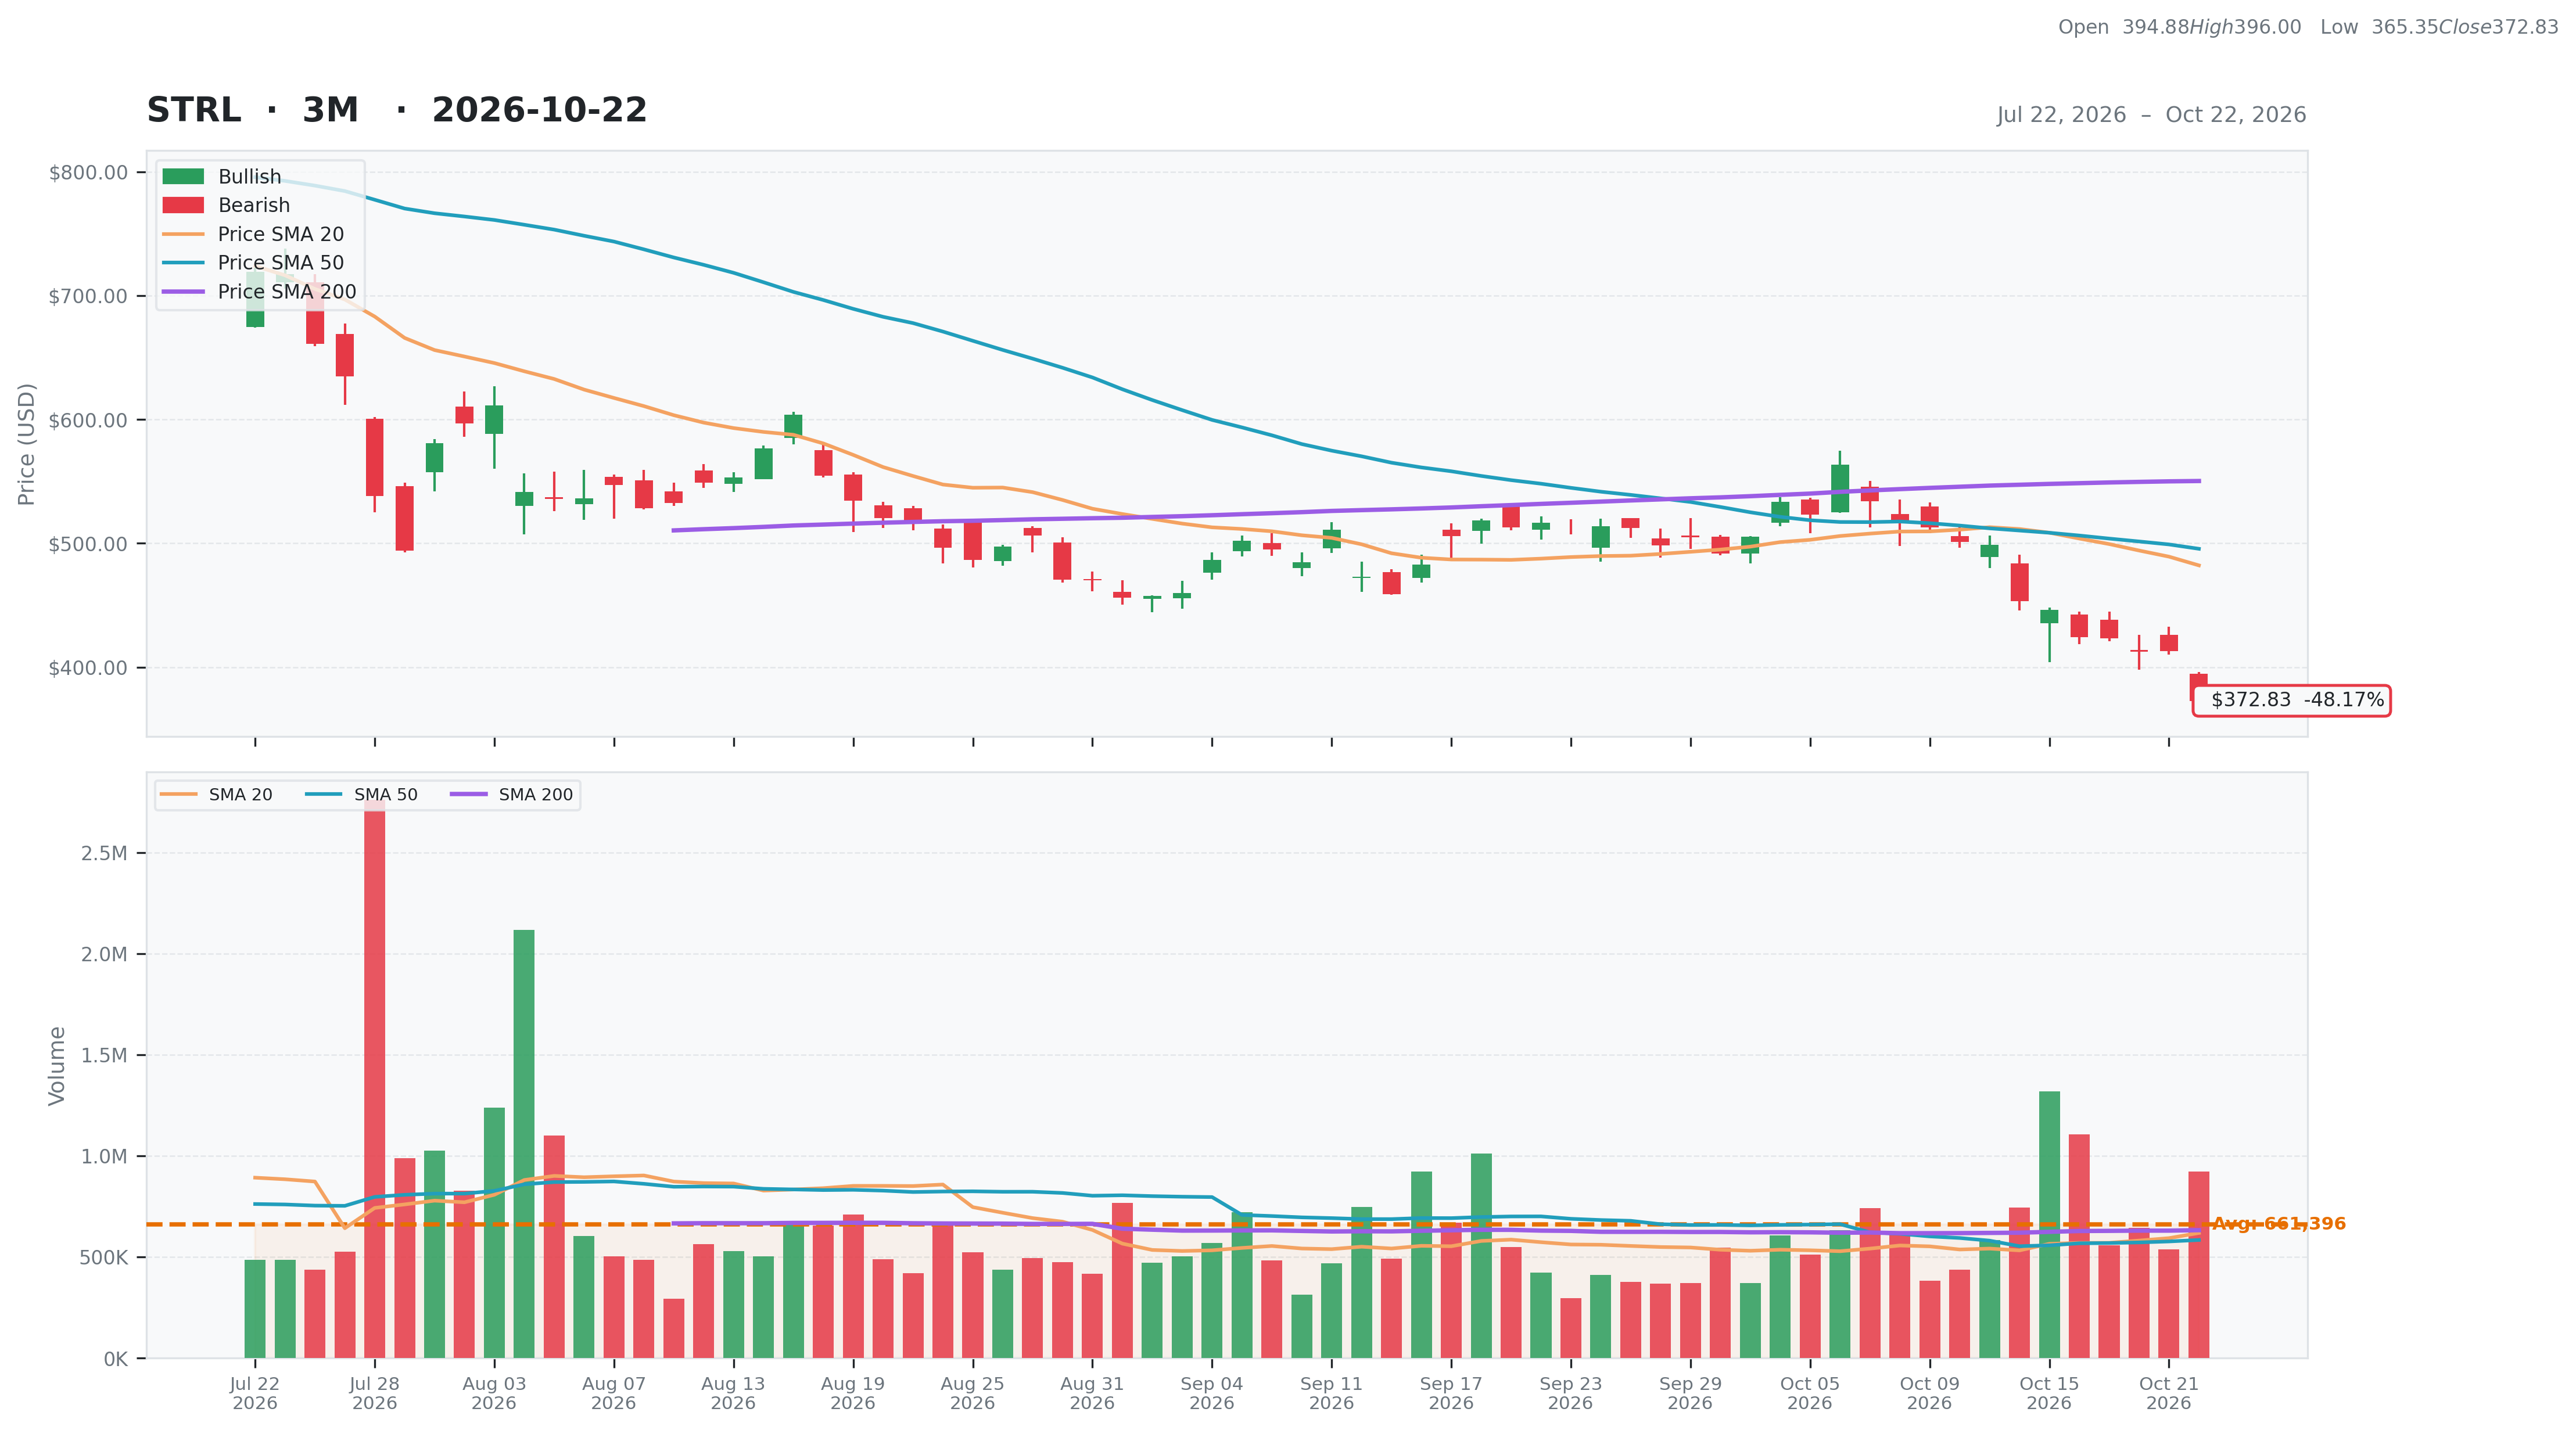
Industrials • Engineering & Construction • $372.83 • MCap: 12,980,543,488
https://www.strlco.com • Sterling Infrastructure, Inc. engages in the provision of e-infrastructure, transportation, and building solutions in the United States. It operates through three segments: E-Infrastructure, Transportation, and Building Solutions. The E-Infrastructure Solutions segment provides site development services for the blue-chip end users in the e-commerce distribution center, data center, manufacturing, warehousing, and power generation sectors. Its Transportation Solutions segment is involved in the development of infrastructure and rehabilitation projects for highways, roads, bridges, airports, ports, rail, and storm drainage systems for the departments of transportation, regional transit, airport, port, water, and railroads authorities. The Building Solutions segment offers residential and commercial concrete foundations for single-family and multi-family homes, parking structures, elevated slabs, and other concrete work for developers and general contractors, as well as plumbing and surveys services for residential builds. It operates in the United States, primarily across the Southern, Northeastern, Mid-Atlantic and Rocky Mountain regions, and the Pacific Islands. The company was formerly known as Sterling Construction Company, Inc. and changed its name to Sterling Infrastructure, Inc. in June 2022. Sterling Infrastructure, Inc. was founded in 1955 and is headquartered in The Woodlands, Texas.
Ex-AAII
| Score | Price | 52 Week & Averages | Relative Strength | Risk | |||||
|---|---|---|---|---|---|---|---|---|---|
| Total | 72 | Current | $372.83 | 52W High | $993.74 -62.48% | Relative Strength | -0.22 | Beta | 1.86 |
| Business Quality | 17 | Weekly | $446.25 -16.45% | 52W Low | $283.57 31.48% | 3M | -0.44 | Short % | 0.04 |
| Financial Strength | 19 | Monthly | $516.57 -27.83% | Above 50DMA | $495.57 -24.77% | 6M | -0.25 | Risk Score | 2 |
| Growth Outlook | 15 | Quarterly | $660.94 -43.59% | Above 200DMA | $550.30 -32.25% | 9M | 0.02 | ||
| Momentum | 3 | Yearly | $376.74 -1.04% | 12M | -0.02 | ||||
| Valuation | Financial Strength | Growth/Profitability | |||
|---|---|---|---|---|---|
| Trailing P/E | 33.65 | Cash | 464M | Revenue Growth | 0.90% |
| Forward P/E | 16.43 | Debt | 337M | Earnings Growth | 1.16% |
| PEG Ratio | 0.55 | Debt/Equity | 24.22 | Qtr Earnings Growth | 1.20% |
| Price/Sales | 3.78 | Current Ratio | 1.11 | Gross Margin | 0.24% |
| Price/Book | 9.60 | Quick Ratio | 1.08 | Operating Margin | 0.20% |
| EV/Revenue | 3.75 | Operating CF | 598M | Profit Margin | 0.13% |
| EV/EBITDA | 18.05 | Free CF | 349M | EBITDA Margin | 0.21% |
| Ent Value | 12,885M | Return on Assets | 0.15% | ||
| Return on Equity | 0.40% | ||||
| Technical | Volume & Bollinger Bands | Analyst | |||
|---|---|---|---|---|---|
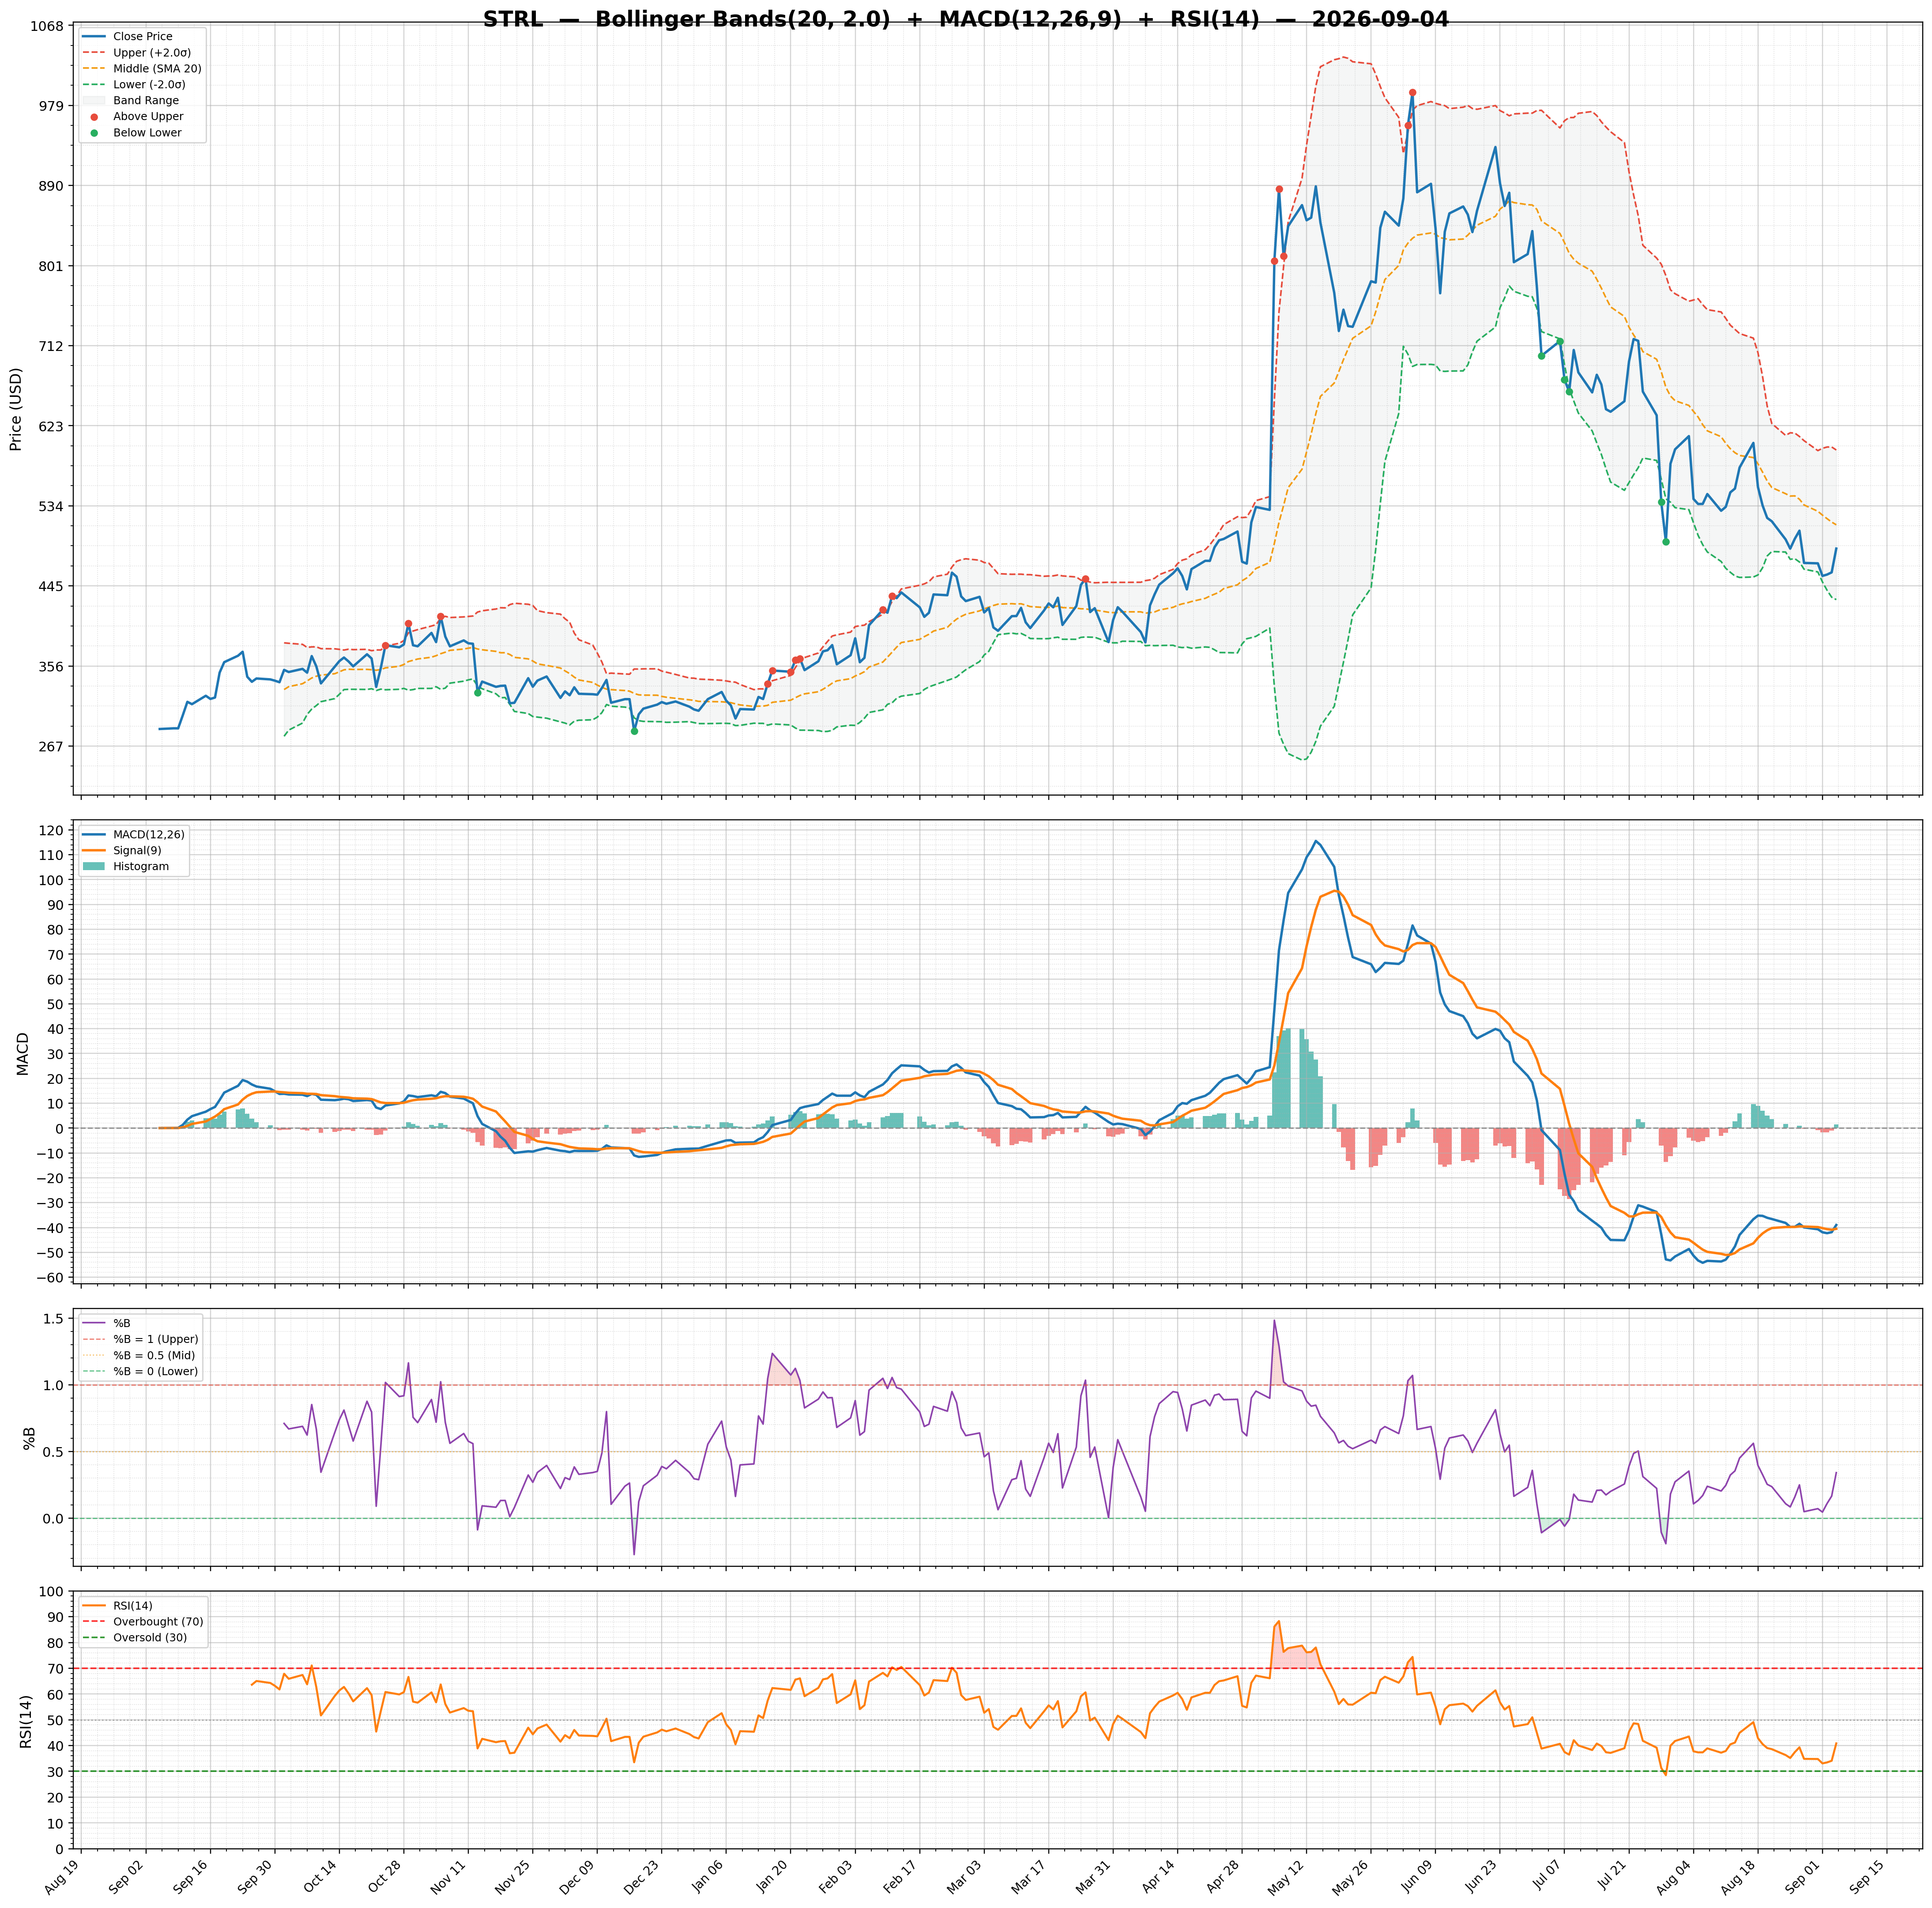
| RSI | 25.56 | Volume | 1.11M | Rating | strong_buy |
| Previous RSI | 31.09 | Avg Volume 20D | 0.62M | Target Mean | $836.71 |
| RSI Trend | Down | Relative Volume | 1.51 | Target High | $1,000.00 |
| MACD | -29.37 | Lower Band | 380.17 | Target Low | $700.00 |
| MACD Signal | -16.64 | Middle Band | 482.17 | Target Median | $755.00 |
| Histogram | -12.73 | Upper Band | 584.18 | Analysts | 7 |
| Previous Histogram | -10.98 | Bandwidth | 42.310 | Upside | 97.17% |
| Histogram Trend | Decreasing | %B | -0.04 | ||