STRATTEC SECURITY CORPORATION (STRT)
Consumer Cyclical • Auto Parts • $60.47 • MCap: 240,967,376
https://www.strattec.com • Strattec Security Corporation, an automotive access company, designs and delivers engineered access solutions for the automotive and mobility markets in North America and internationally. The company offers locks and keys solutions, such as ignition locks, interior locks, door locks, secondary locks, mechanical keys, integrated keys and fobs, steering column locks, start and stop buttons, and key fobs; and door handles and accessories. It also provides power access, including power sliding doors, power liftgates, power endgates, and power decklid; latches comprising power liftgate latches, power tailgate latches, deckgate latches, and hood latches; and one-key technology under the BOLT Lock brand. Strattec Security Corporation was founded in 1908 and is headquartered in Milwaukee, Wisconsin.
Ex-AAII
| Score | Price | 52 Week & Averages | Relative Strength | Risk | |||||
|---|---|---|---|---|---|---|---|---|---|
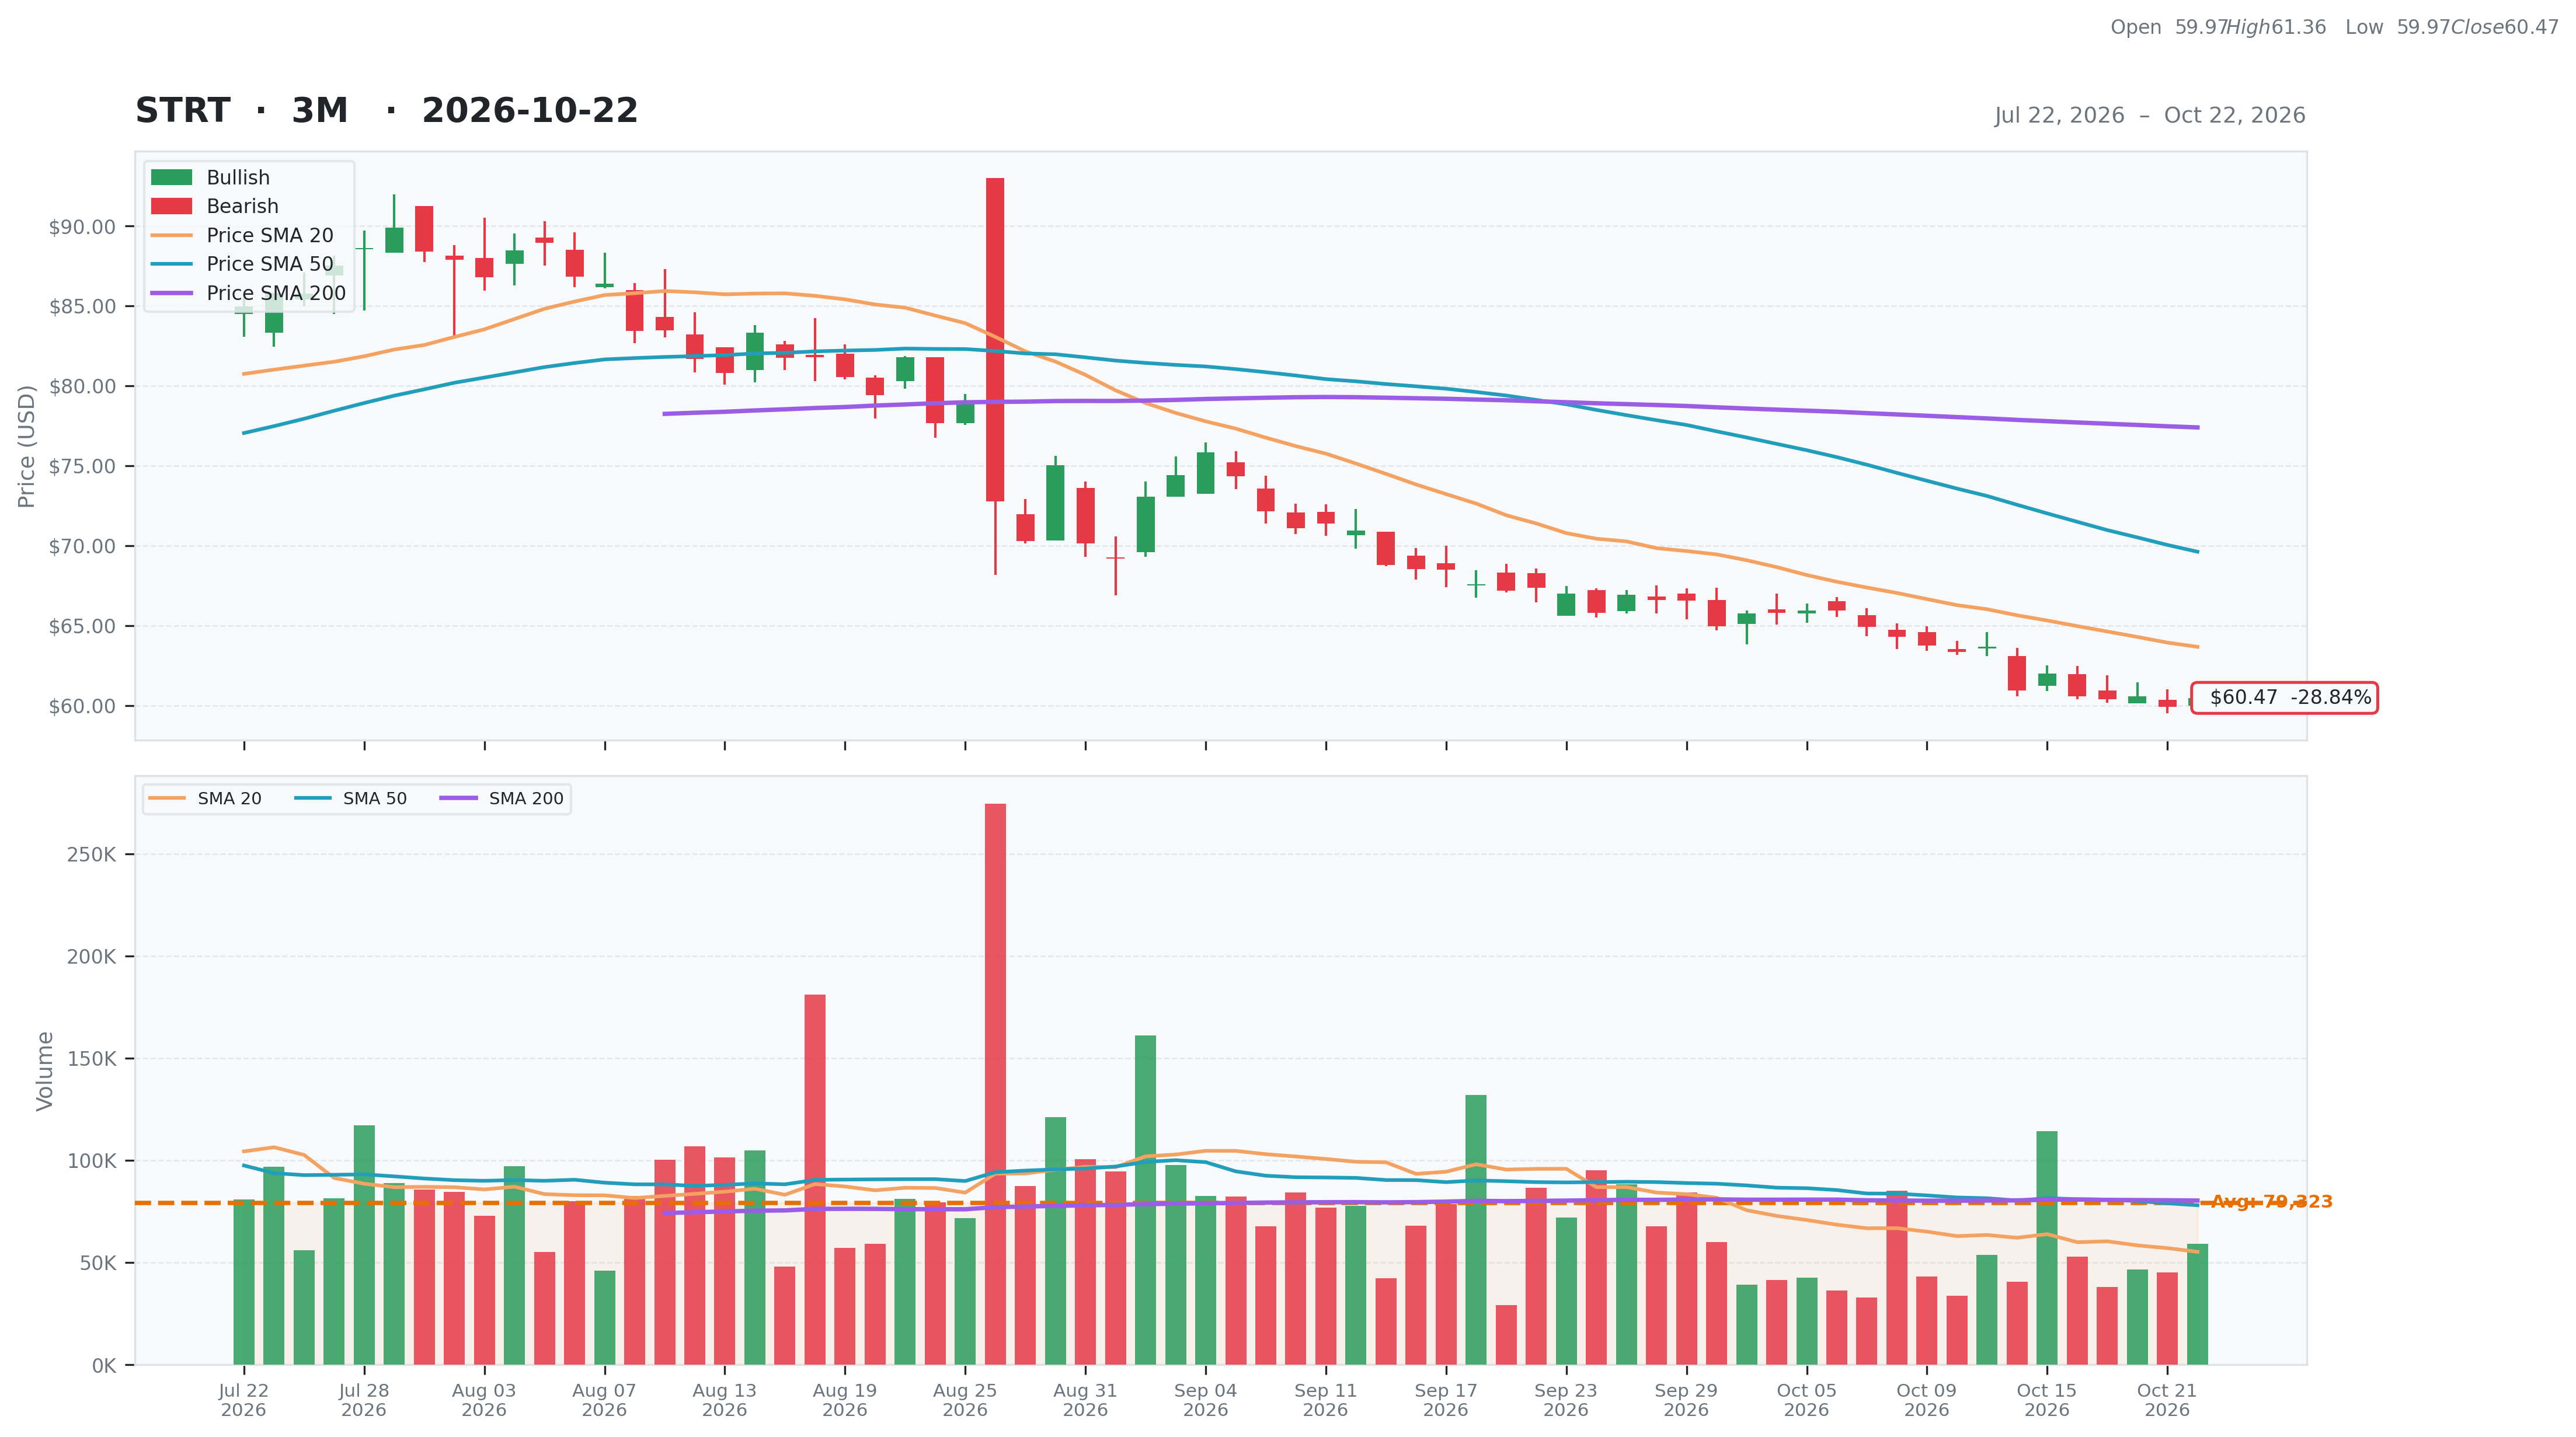
| Total | 41 | Current | $60.47 | 52W High | $90.91 -33.48% | Relative Strength | -0.24 | Beta | 1.23 |
| Business Quality | 1 | Weekly | $61.98 -2.44% | 52W Low | $59.91 0.93% | 3M | -0.30 | Short % | 0.09 |
| Financial Strength | 13 | Monthly | $67.36 -10.23% | Above 50DMA | $69.62 -13.14% | 6M | -0.24 | Risk Score | 1 |
| Growth Outlook | 4 | Quarterly | $85.78 -29.51% | Above 200DMA | $77.39 -21.87% | 9M | -0.27 | ||
| Momentum | 2 | Yearly | $66.57 -9.16% | 12M | -0.12 | ||||
| Valuation | Financial Strength | Growth/Profitability | |||
|---|---|---|---|---|---|
| Trailing P/E | 12.12 | Cash | 108M | Revenue Growth | 0.00% |
| Forward P/E | 10.52 | Debt | 2M | Earnings Growth | -0.52% |
| PEG Ratio | 1.45 | Debt/Equity | 0.93 | Qtr Earnings Growth | -0.53% |
| Price/Sales | 0.42 | Current Ratio | 2.90 | Gross Margin | 0.16% |
| Price/Book | 1.01 | Quick Ratio | 2.15 | Operating Margin | 0.01% |
| EV/Revenue | 0.28 | Operating CF | 46M | Profit Margin | 0.04% |
| EV/EBITDA | 4.00 | Free CF | 27M | EBITDA Margin | 0.07% |
| Ent Value | 163M | Return on Assets | 0.04% | ||
| Return on Equity | 0.08% | ||||
| Technical | Volume & Bollinger Bands | Analyst | |||
|---|---|---|---|---|---|
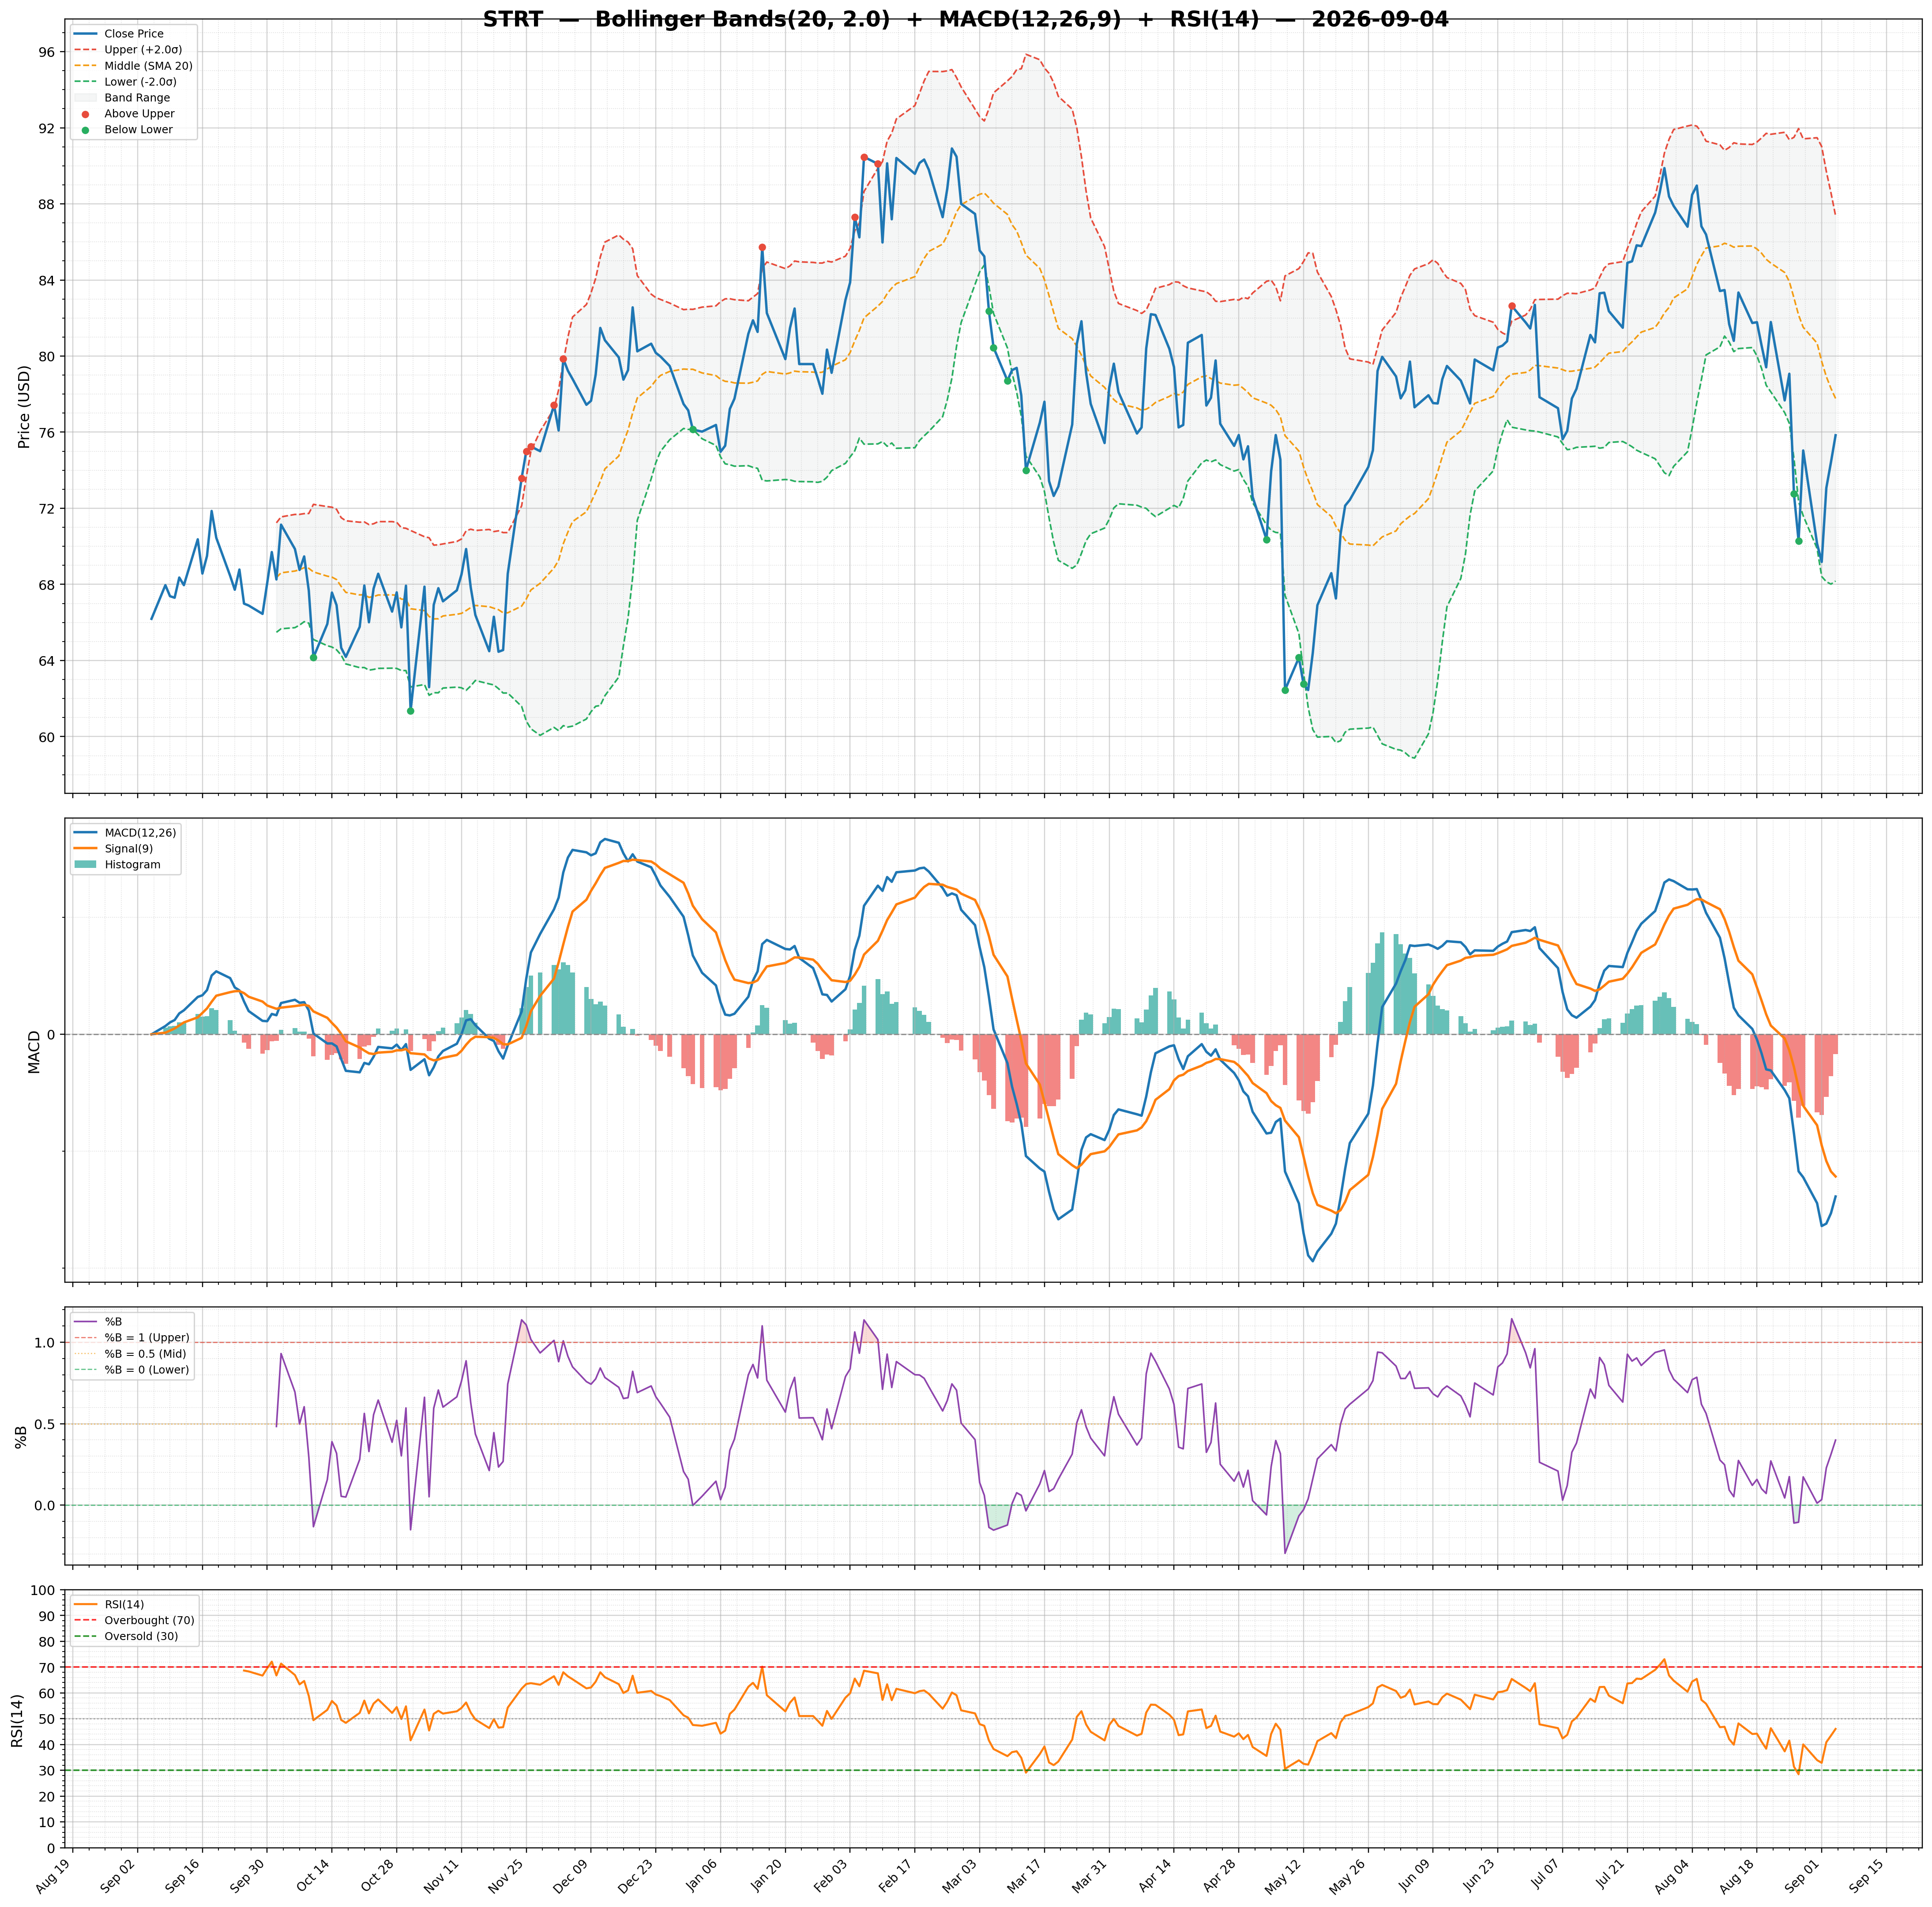
| RSI | 29.94 | Volume | 0.05M | Rating | none |
| Previous RSI | 26.46 | Avg Volume 20D | 0.06M | Target Mean | $82.00 |
| RSI Trend | Up | Relative Volume | 0.95 | Target High | $83.00 |
| MACD | -2.71 | Lower Band | 58.75 | Target Low | $81.00 |
| MACD Signal | -2.70 | Middle Band | 63.66 | Target Median | $82.00 |
| Histogram | -0.01 | Upper Band | 68.58 | Analysts | 2 |
| Previous Histogram | -0.07 | Bandwidth | 15.440 | Upside | 35.36% |
| Histogram Trend | Increasing | %B | 0.18 | ||