Titan Machinery Inc. (TITN)
Industrials • Industrial Distribution • $22.99 • MCap: 521,959,648
https://www.titanmachinery.com • Titan Machinery Inc. owns and operates a network of full service agricultural and construction equipment stores in the United States, Europe, and Australia. The company operates through four segments: Agriculture, Construction, Europe, and Australia. It sells new and used equipment, including agricultural and construction equipment manufactured under the CNH Industrial family of brands, as well as equipment from various other manufacturers. The company offers agricultural equipment, including machinery and attachments for use in the production of food, fiber, feed grain, feedstock, and renewable energy; and home and garden applications, as well as maintenance of commercial, residential, and government properties. It also provides construction equipment, such as heavy construction machinery, light industrial machinery for commercial and residential construction, and road and highway construction machinery. In addition, the company offers repair and maintenance services that include warranty repairs, off-site and on-site repair services, scheduling off-season maintenance services, and notifying customers of periodic service requirements; and training programs to customers, as well as sells maintenance and replacement parts. Further, the company rents equipment; and provides ancillary equipment support services, such as equipment transportation, global positioning system signal subscriptions and other precision farming products, farm data management products, and finance and insurance products. It operates in Colorado, Idaho, Iowa, Kansas, Minnesota, Nebraska, North Dakota, South Dakota, Wisconsin, and Wyoming, the United States; Bulgaria, Germany, Romania, and Ukraine, Europe; and New South Wales, South Australia, and Victoria, and Australia. The company was founded in 1980 and is headquartered in West Fargo, North Dakota.
Ex-AAII
| Score | Price | 52 Week & Averages | Relative Strength | Risk | |||||
|---|---|---|---|---|---|---|---|---|---|
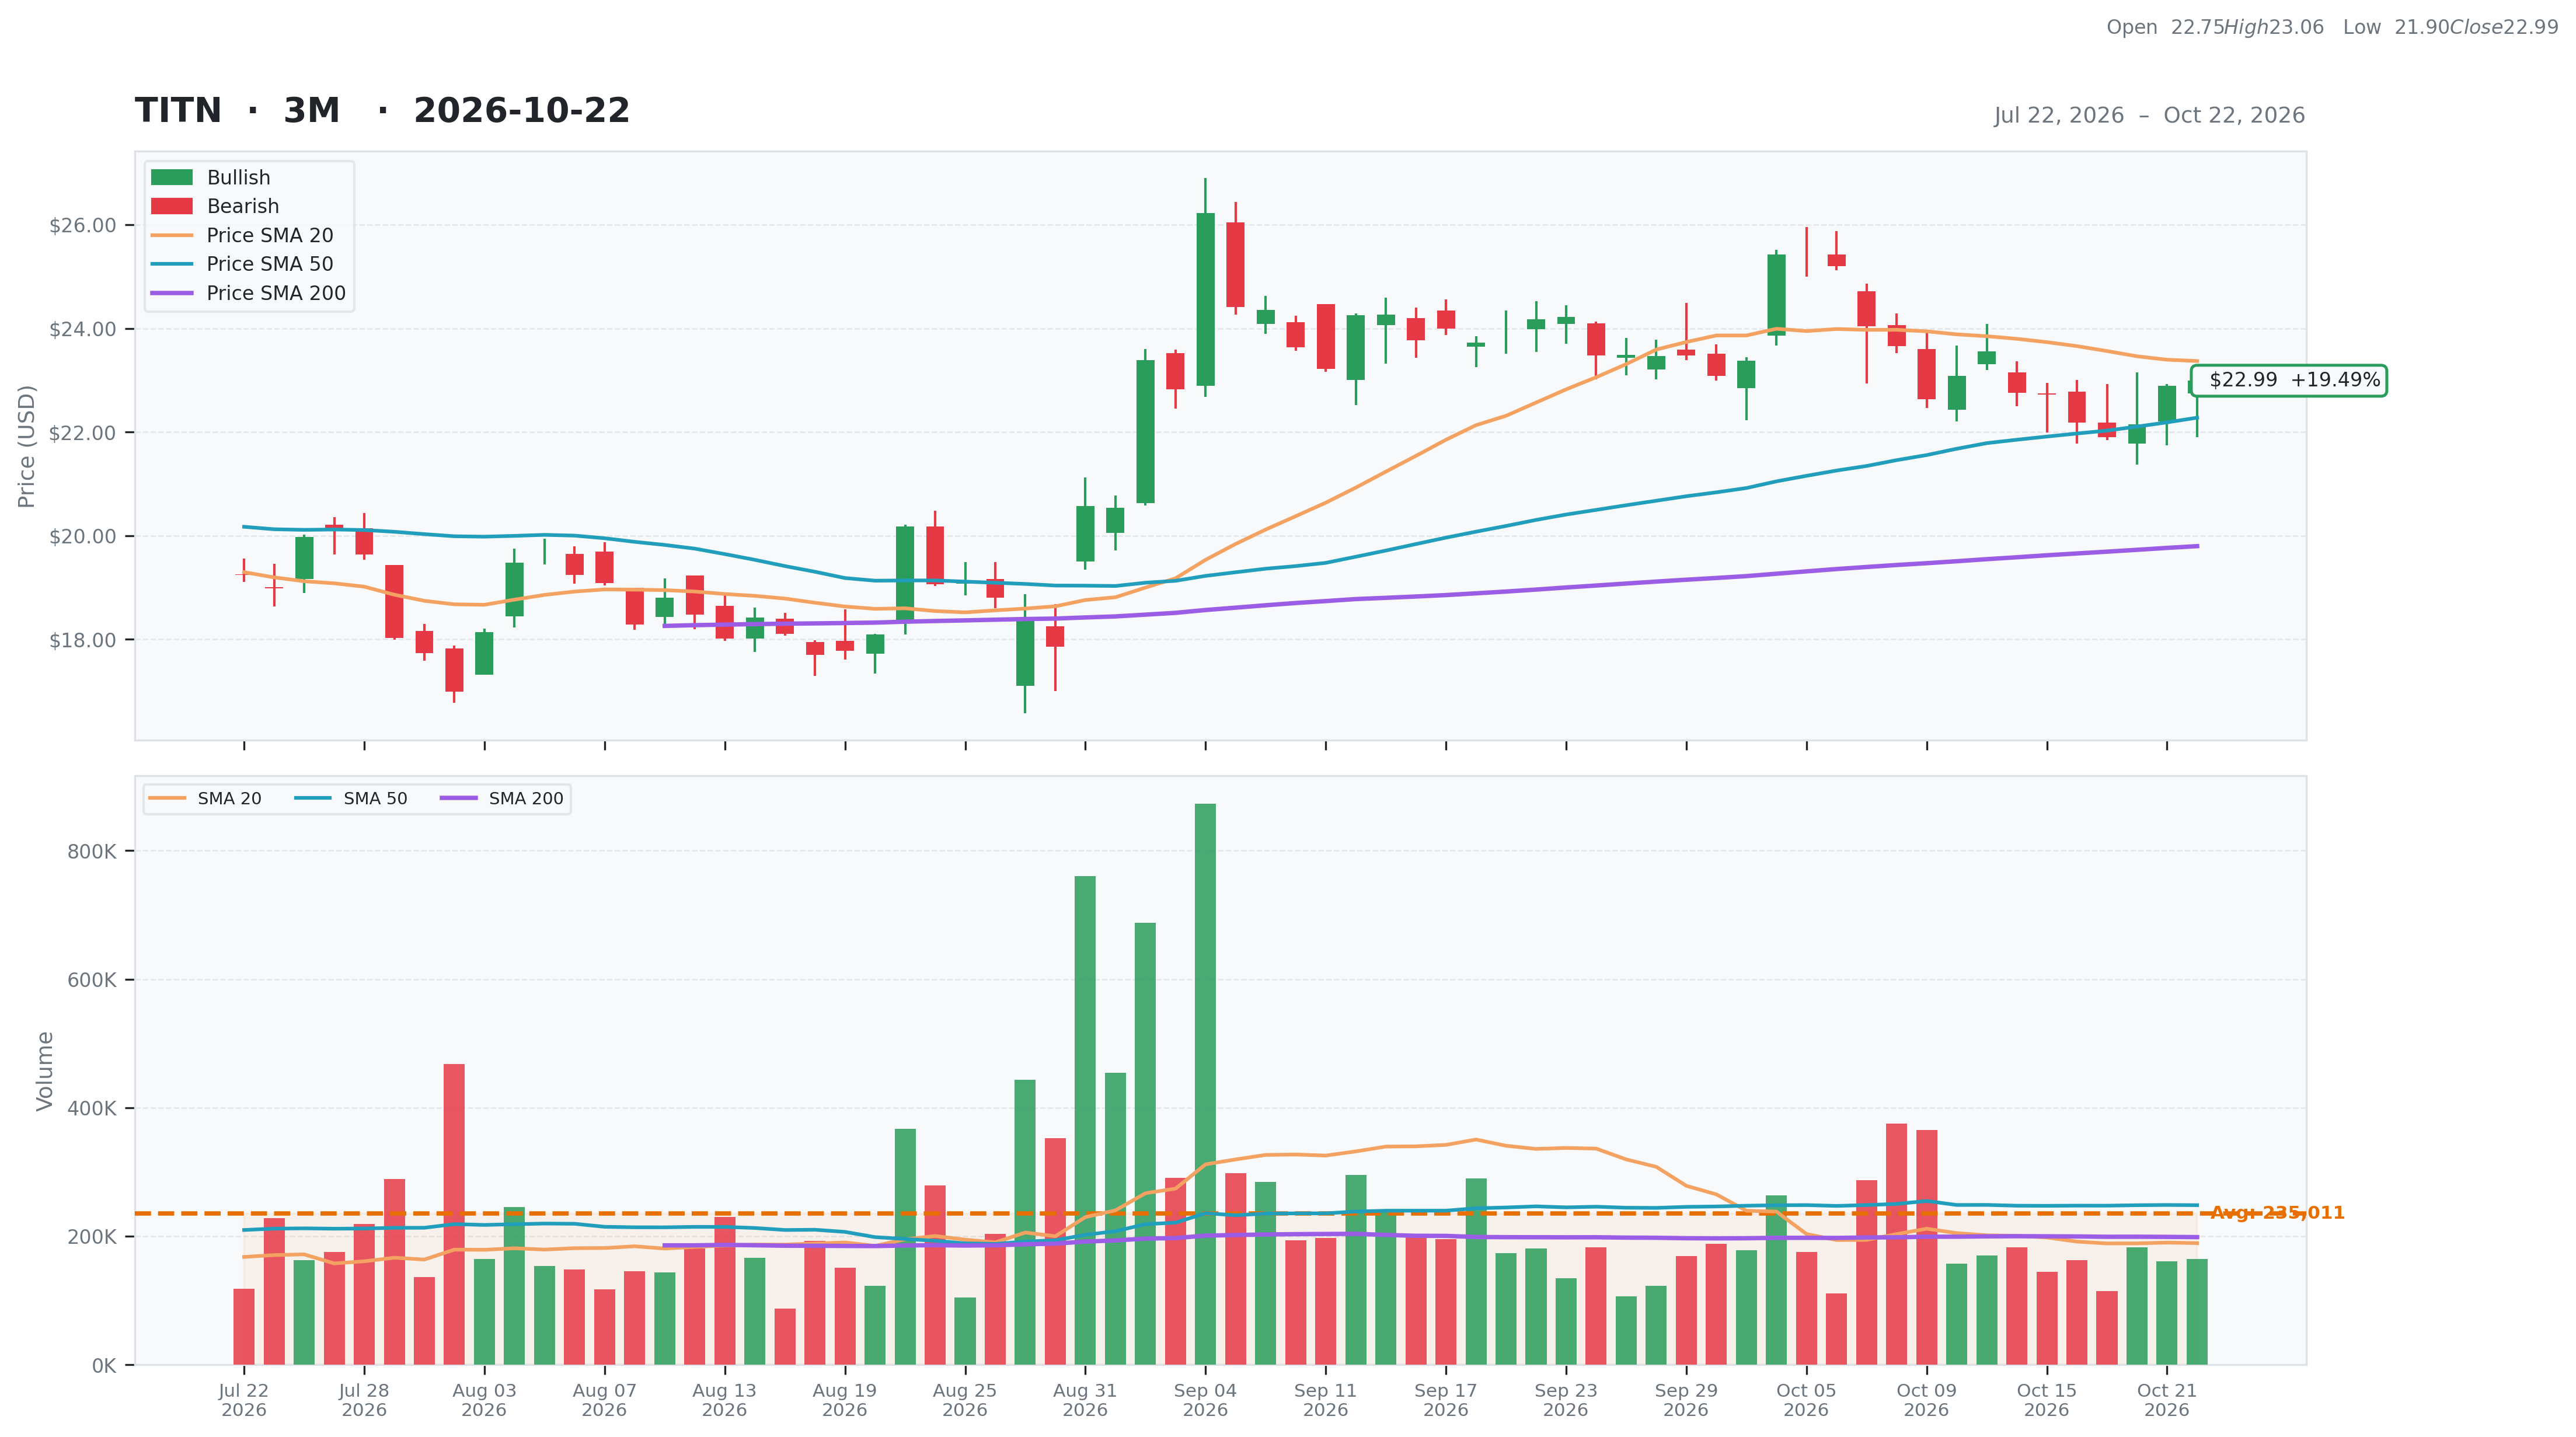
| Total | 27 | Current | $22.99 | 52W High | $26.22 -12.32% | Relative Strength | 0.24 | Beta | 1.41 |
| Business Quality | 1 | Weekly | $22.72 1.19% | 52W Low | $14.15 62.47% | 3M | 0.15 | Short % | 0.05 |
| Financial Strength | 4 | Monthly | $24.17 -4.88% | Above 50DMA | $22.28 3.20% | 6M | 0.07 | Risk Score | 6 |
| Growth Outlook | 1 | Quarterly | $19.98 15.07% | Above 200DMA | $19.80 16.12% | 9M | 0.38 | ||
| Momentum | 3 | Yearly | $16.40 40.18% | 12M | 0.44 | ||||
| Valuation | Financial Strength | Growth/Profitability | |||
|---|---|---|---|---|---|
| Trailing P/E | N/A | Cash | 30M | Revenue Growth | -0.09% |
| Forward P/E | -39.08 | Debt | 896M | Earnings Growth | N/A |
| PEG Ratio | 1.77 | Debt/Equity | 160.60 | Qtr Earnings Growth | N/A |
| Price/Sales | 0.23 | Current Ratio | 1.35 | Gross Margin | 0.16% |
| Price/Book | 0.91 | Quick Ratio | 0.17 | Operating Margin | 0.00% |
| EV/Revenue | 0.60 | Operating CF | 62M | Profit Margin | -0.02% |
| EV/EBITDA | 42.02 | Free CF | 238M | EBITDA Margin | 0.01% |
| Ent Value | 1,376M | Return on Assets | 0.00% | ||
| Return on Equity | -0.10% | ||||
| Technical | Volume & Bollinger Bands | Analyst | |||
|---|---|---|---|---|---|
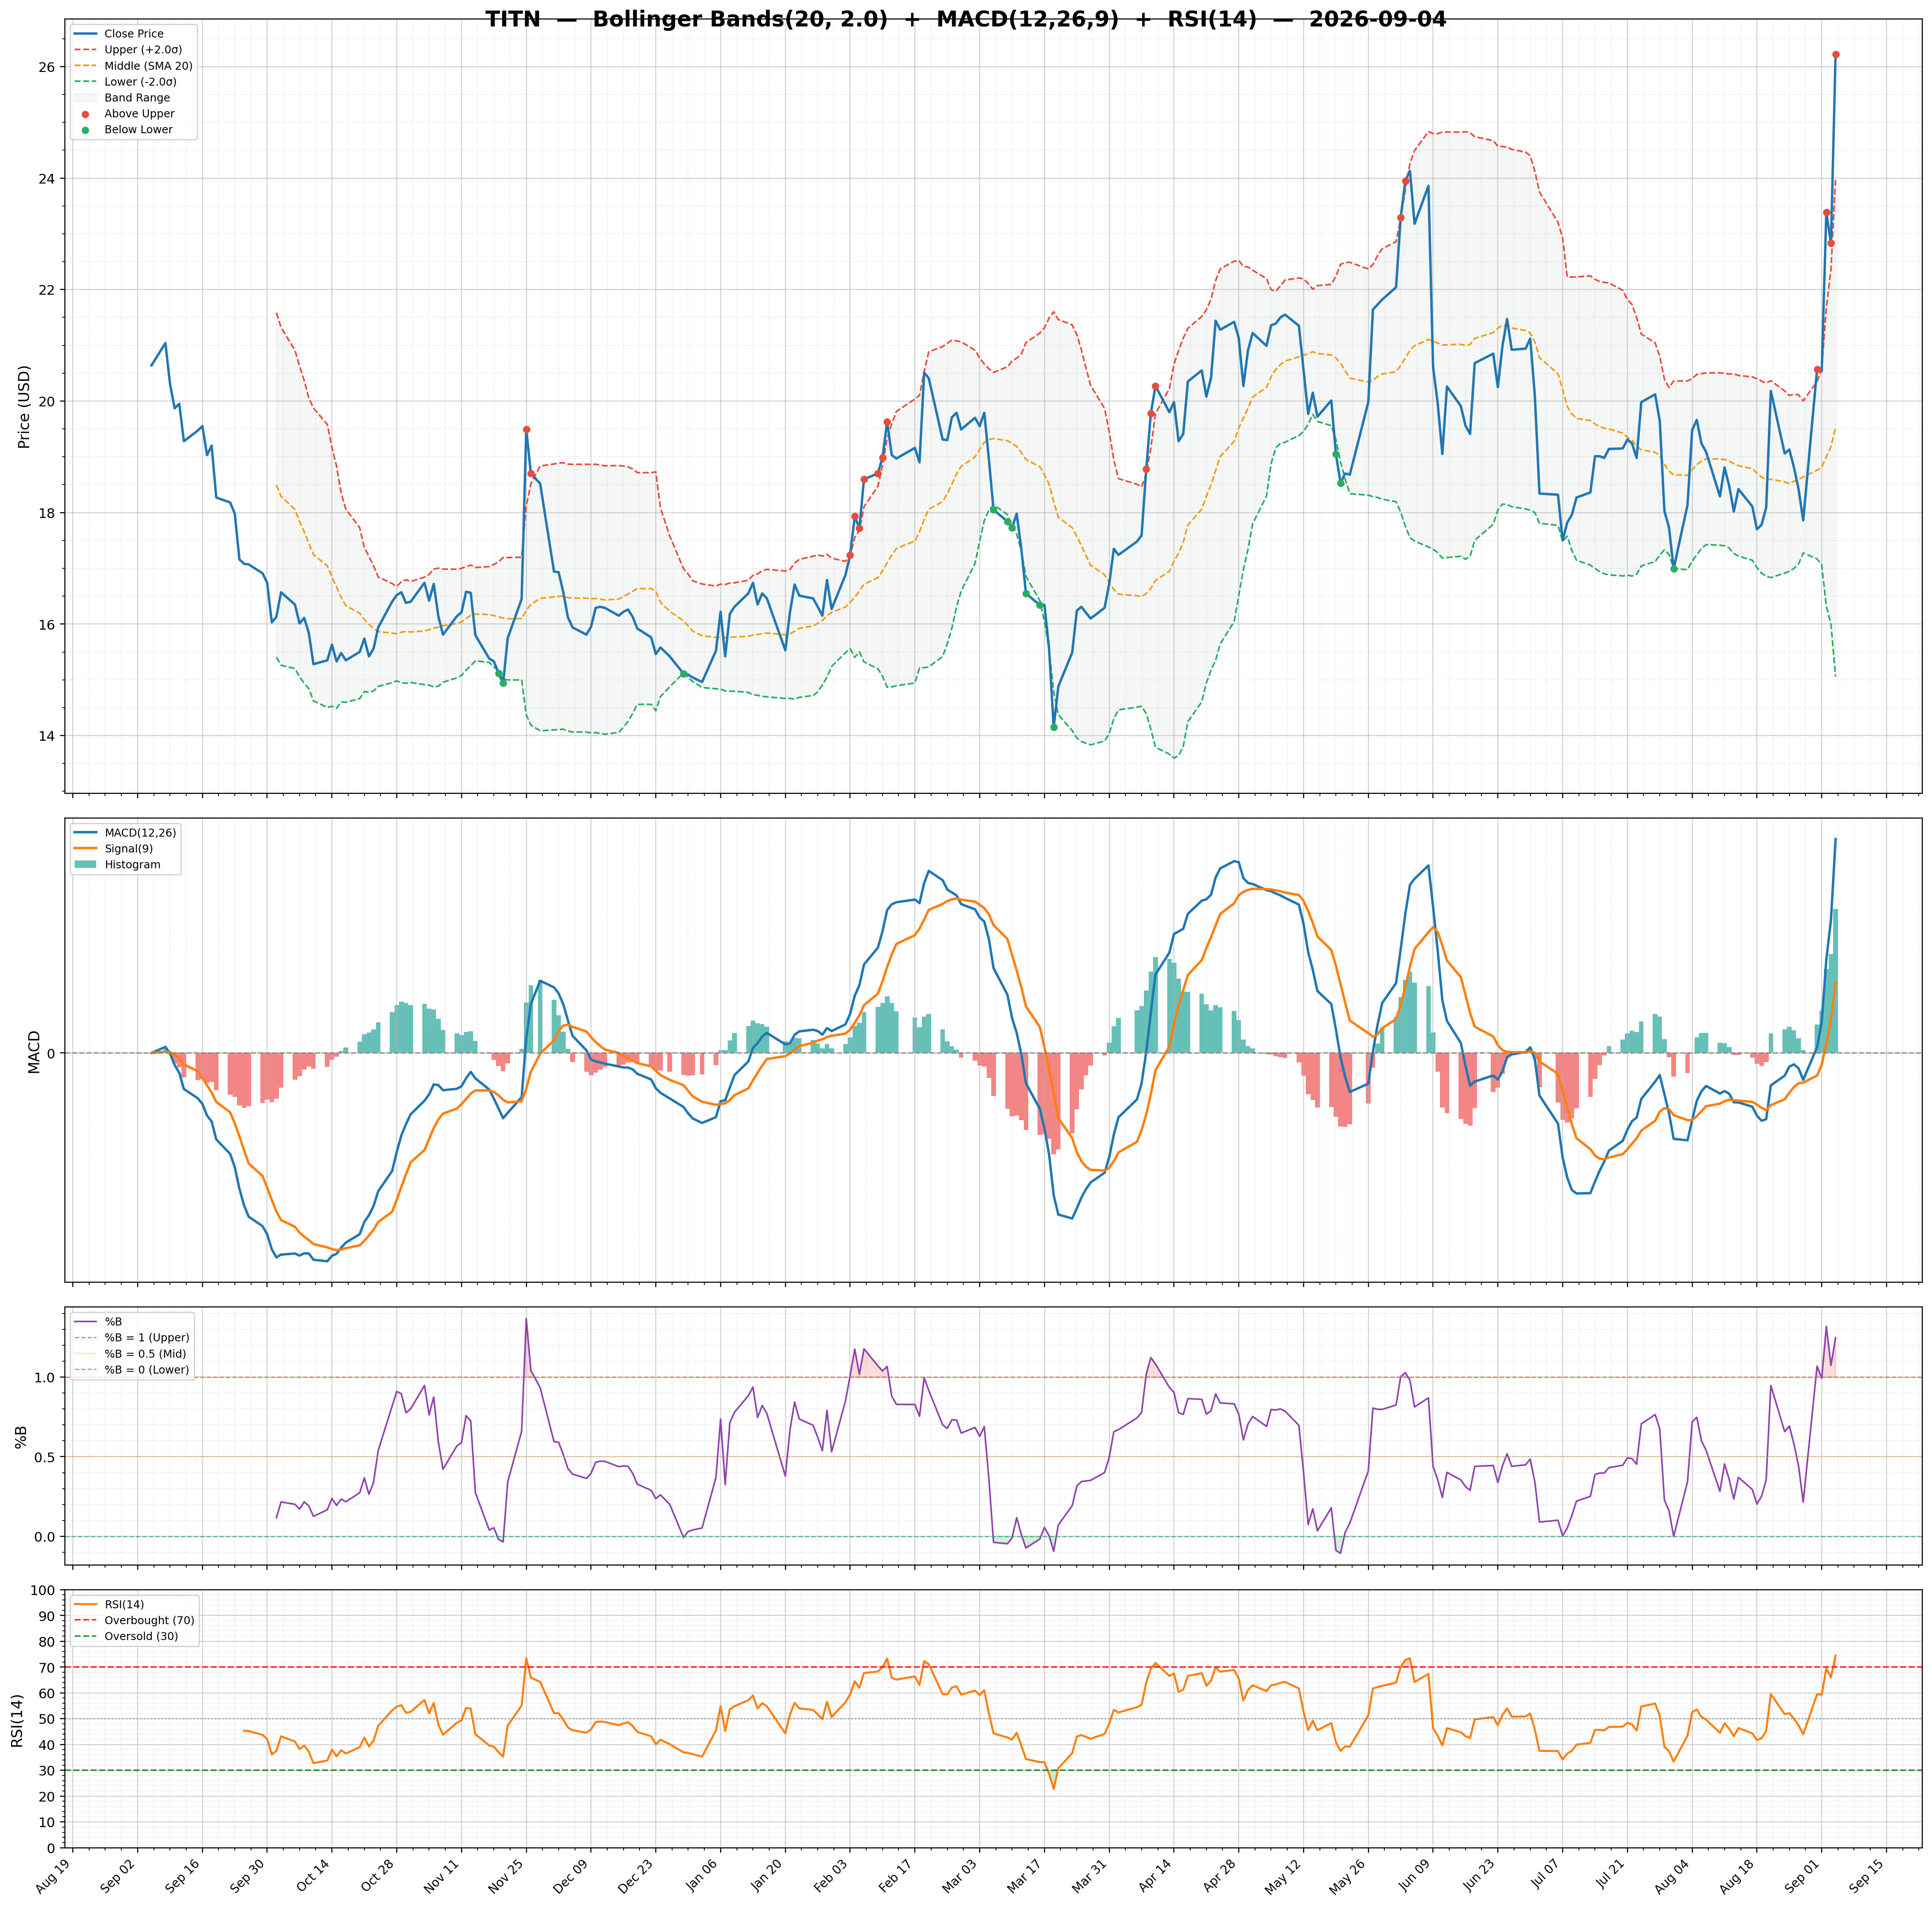
| RSI | 50.11 | Volume | 0.16M | Rating | strong_buy |
| Previous RSI | 49.39 | Avg Volume 20D | 0.19M | Target Mean | $25.25 |
| RSI Trend | Up | Relative Volume | 0.84 | Target High | $29.00 |
| MACD | -0.08 | Lower Band | 21.37 | Target Low | $22.00 |
| MACD Signal | 0.12 | Middle Band | 23.37 | Target Median | $25.00 |
| Histogram | -0.20 | Upper Band | 25.37 | Analysts | 4 |
| Previous Histogram | -0.27 | Bandwidth | 17.090 | Upside | 13.84% |
| Histogram Trend | Increasing | %B | 0.40 | ||