Turning Point Brands, Inc. (TPB)
Consumer Defensive • Tobacco • $66.87 • MCap: 1,256,065,024
https://www.turningpointbrands.com • Turning Point Brands, Inc., together with its subsidiaries, manufactures, markets, and distributes branded consumer products in the United States and Canada. The company operates through two segments, Zig-Zag Products and Stoker's Products. Its Zig-Zag Products segment markets and distributes rolling papers, tubes, finished cigars, make-your-own cigar wraps, and related products, as well as lighters and other accessories under the Zig-Zag brand. The Stoker's Products segment manufactures and markets moist snuff tobacco and loose-leaf chewing tobacco products under the Stoker's, FRE, Beech-Nut, Durango, Trophy, and Wind River brands. In addition, the company markets and distributes cannabis accessories and tobacco products. It sells its products to wholesale distributors and retail merchants in the independent and chain convenience stores, tobacco outlets, food stores, mass merchandising, drug store, and non-traditional retail channels. The company was formerly known as North Atlantic Holding Company, Inc. and changed its name to Turning Point Brands, Inc. in November 2015. Turning Point Brands, Inc. was founded in 1988 and is headquartered in Louisville, Kentucky.
ET
| Score | Price | 52 Week & Averages | Relative Strength | Risk | |||||
|---|---|---|---|---|---|---|---|---|---|
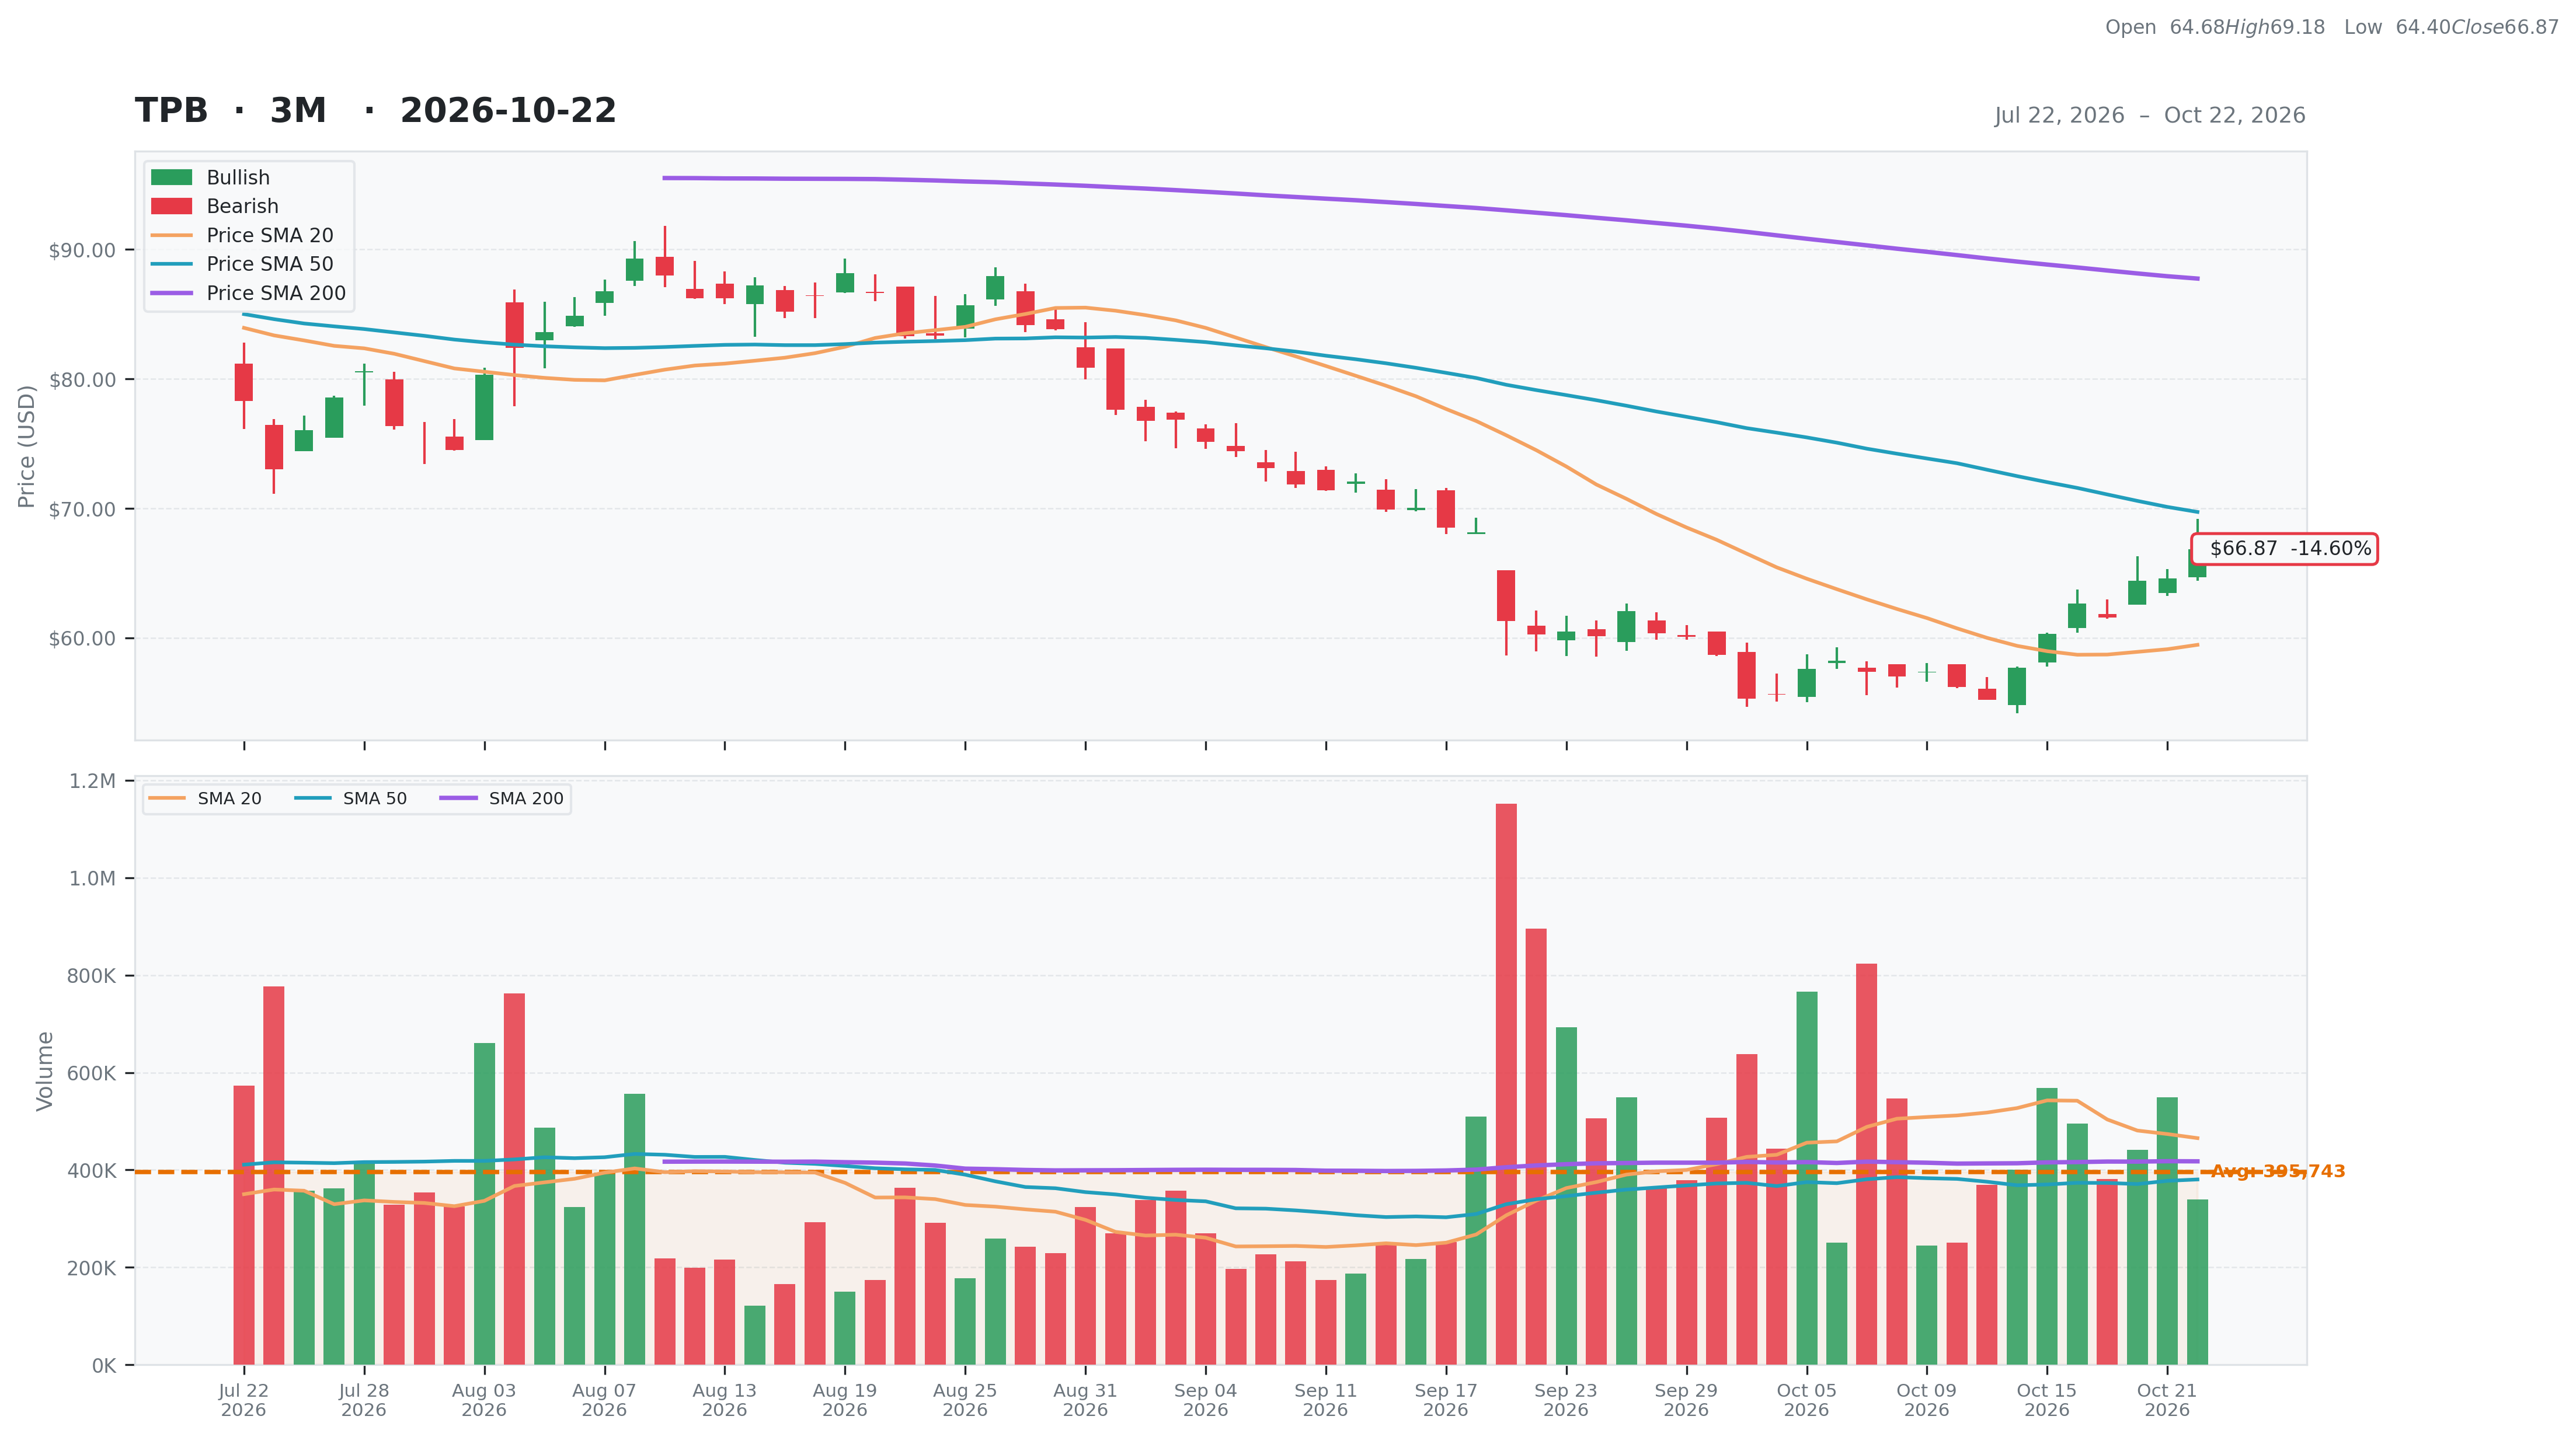
| Total | 50 | Current | $66.87 | 52W High | $142.54 -53.09% | Relative Strength | -0.21 | Beta | 0.97 |
| Business Quality | 12 | Weekly | $60.31 10.88% | 52W Low | $55.25 21.03% | 3M | -0.12 | Short % | 0.17 |
| Financial Strength | 15 | Monthly | $60.28 10.93% | Above 50DMA | $69.73 -4.11% | 6M | -0.11 | Risk Score | 4 |
| Growth Outlook | 0 | Quarterly | $76.03 -12.05% | Above 200DMA | $87.75 -23.80% | 9M | -0.43 | ||
| Momentum | 2 | Yearly | $88.53 -24.47% | 12M | -0.26 | ||||
| Valuation | Financial Strength | Growth/Profitability | |||
|---|---|---|---|---|---|
| Trailing P/E | 27.00 | Cash | 268M | Revenue Growth | 0.23% |
| Forward P/E | 27.89 | Debt | 311M | Earnings Growth | -0.77% |
| PEG Ratio | 0.05 | Debt/Equity | 68.43 | Qtr Earnings Growth | -0.75% |
| Price/Sales | 2.48 | Current Ratio | 5.67 | Gross Margin | 0.57% |
| Price/Book | 2.92 | Quick Ratio | 3.47 | Operating Margin | 0.04% |
| EV/Revenue | 2.61 | Operating CF | 32M | Profit Margin | 0.09% |
| EV/EBITDA | 17.59 | Free CF | -8M | EBITDA Margin | 0.15% |
| Ent Value | 1,322M | Return on Assets | 0.06% | ||
| Return on Equity | 0.18% | ||||
| Technical | Volume & Bollinger Bands | Analyst | |||
|---|---|---|---|---|---|
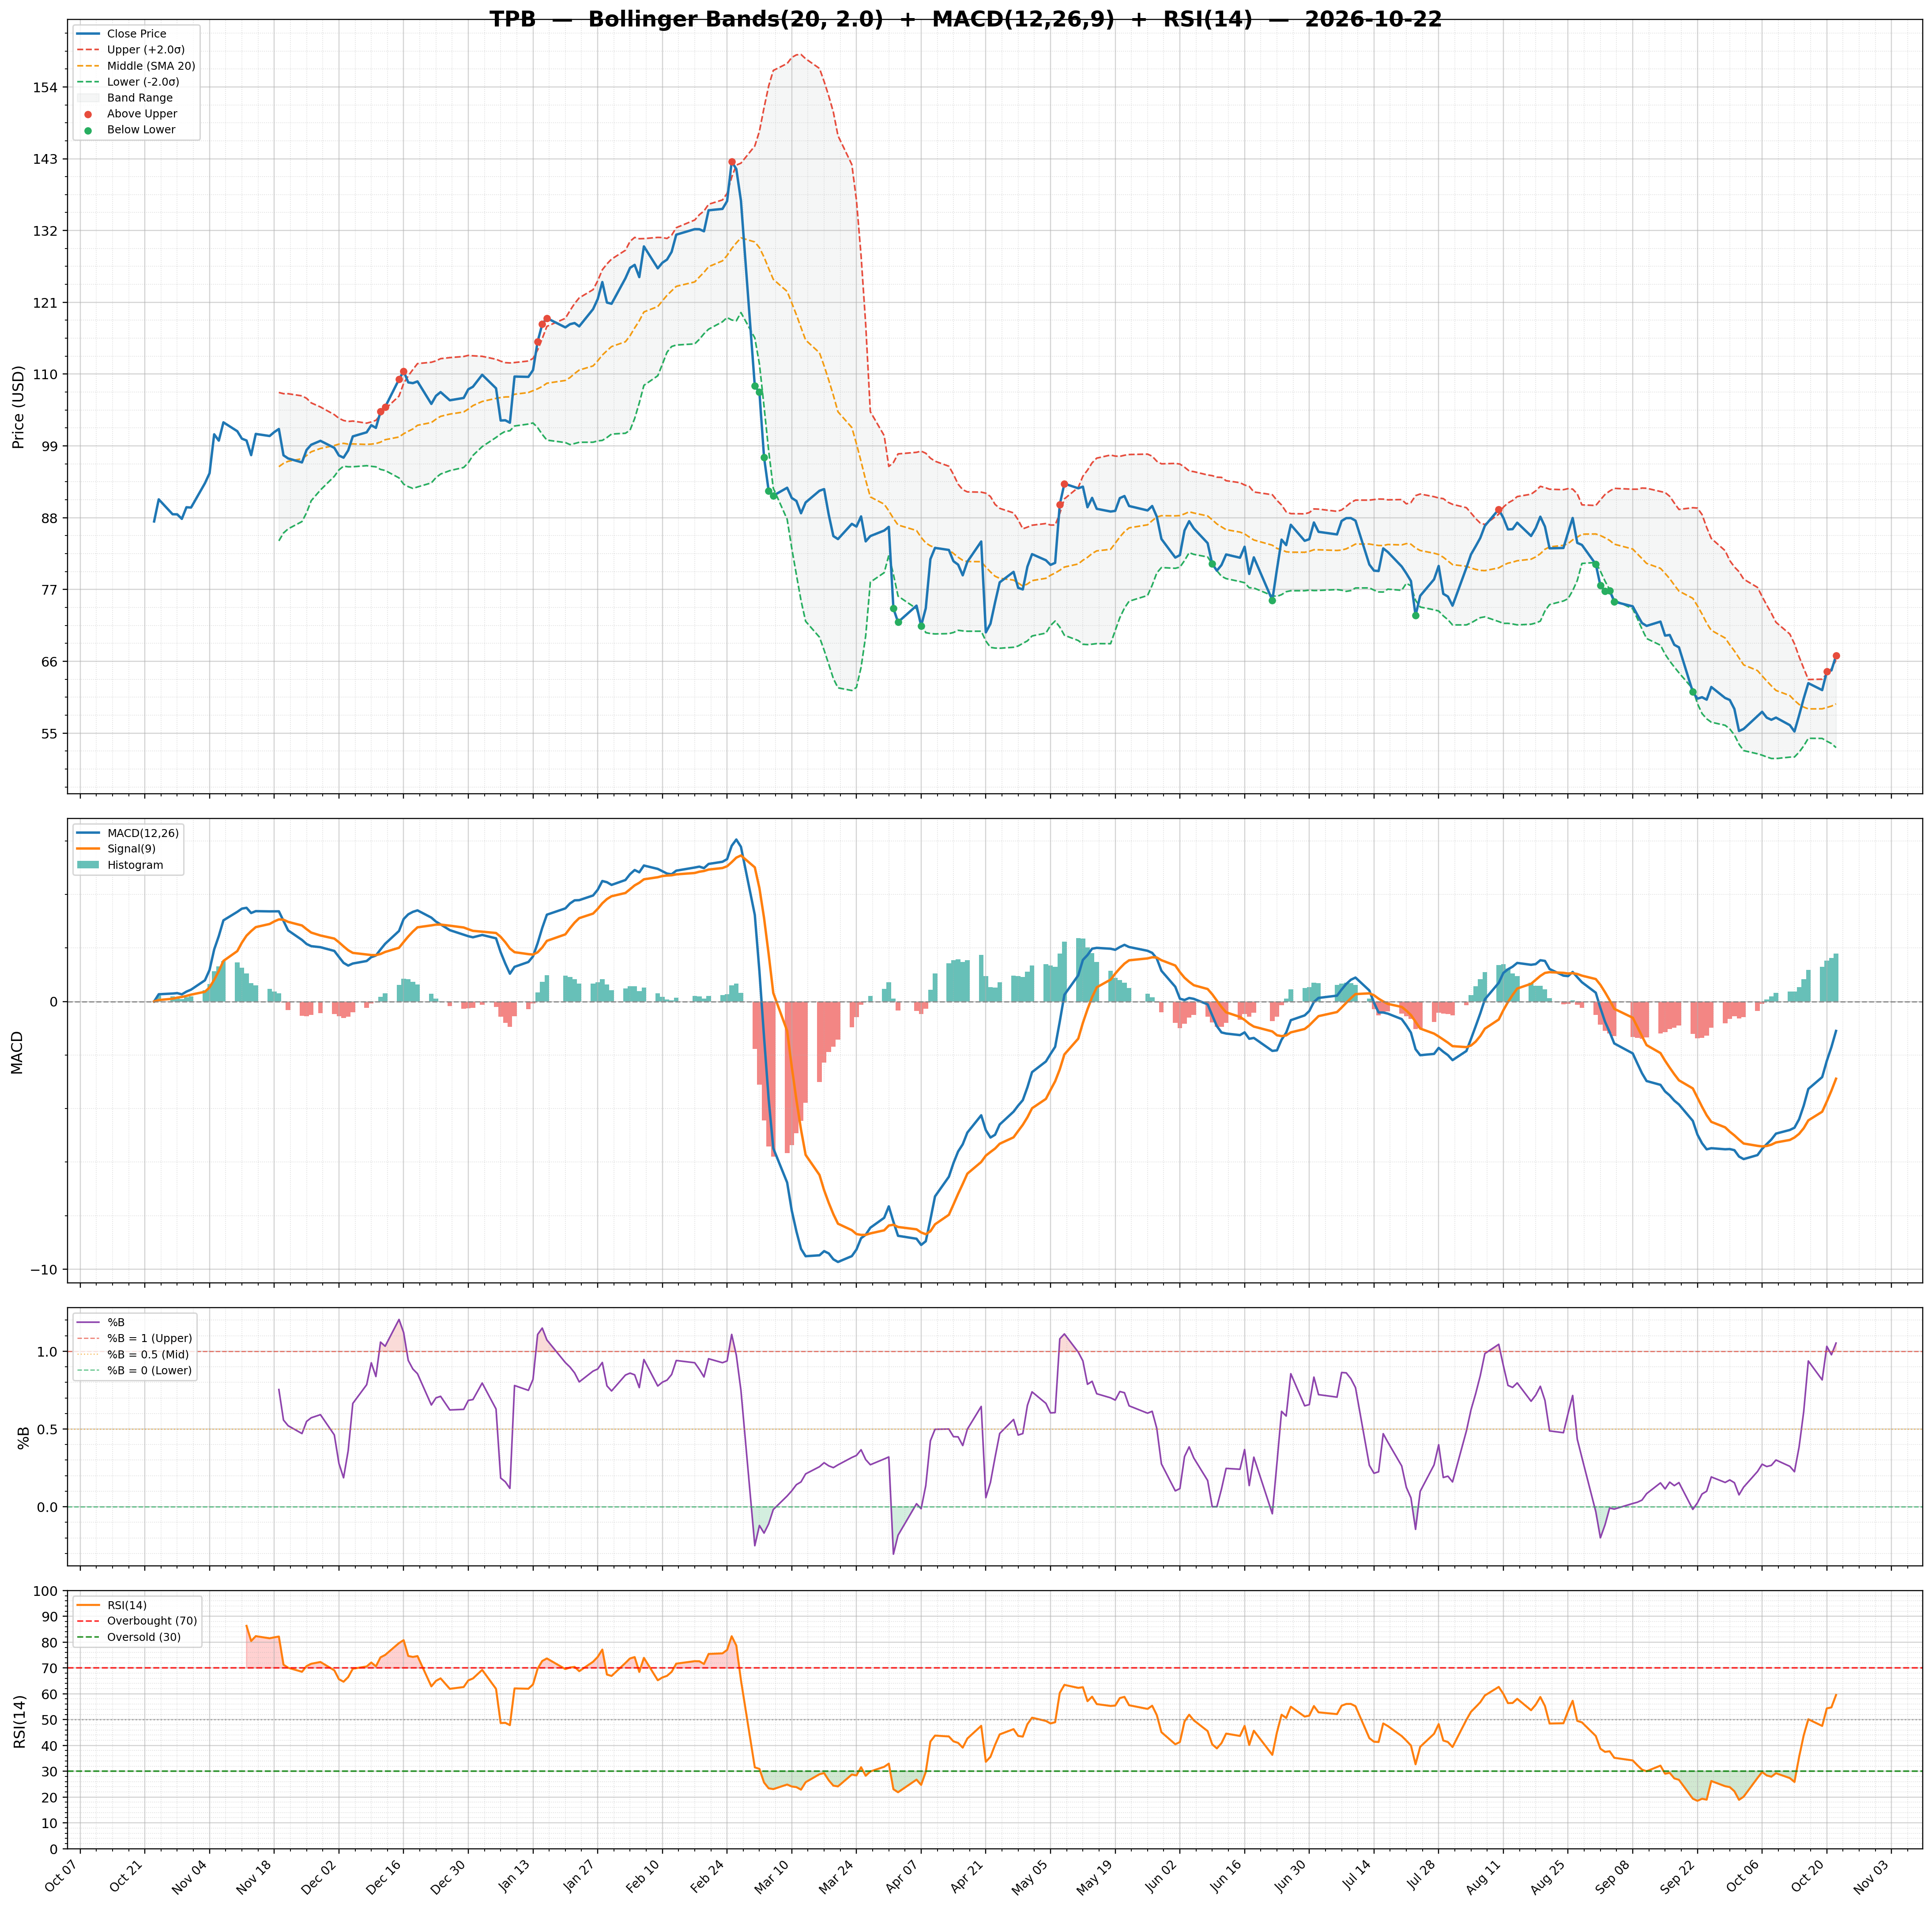
| RSI | 59.54 | Volume | 0.5M | Rating | none |
| Previous RSI | 54.74 | Avg Volume 20D | 0.47M | Target Mean | $118.50 |
| RSI Trend | Up | Relative Volume | 0.72 | Target High | $140.00 |
| MACD | -1.10 | Lower Band | 52.78 | Target Low | $90.00 |
| MACD Signal | -2.88 | Middle Band | 59.48 | Target Median | $120.50 |
| Histogram | 1.78 | Upper Band | 66.17 | Analysts | 6 |
| Previous Histogram | 1.63 | Bandwidth | 22.500 | Upside | 89.15% |
| Histogram Trend | Increasing | %B | 1.05 | ||