ReposiTrak, Inc. (TRAK)
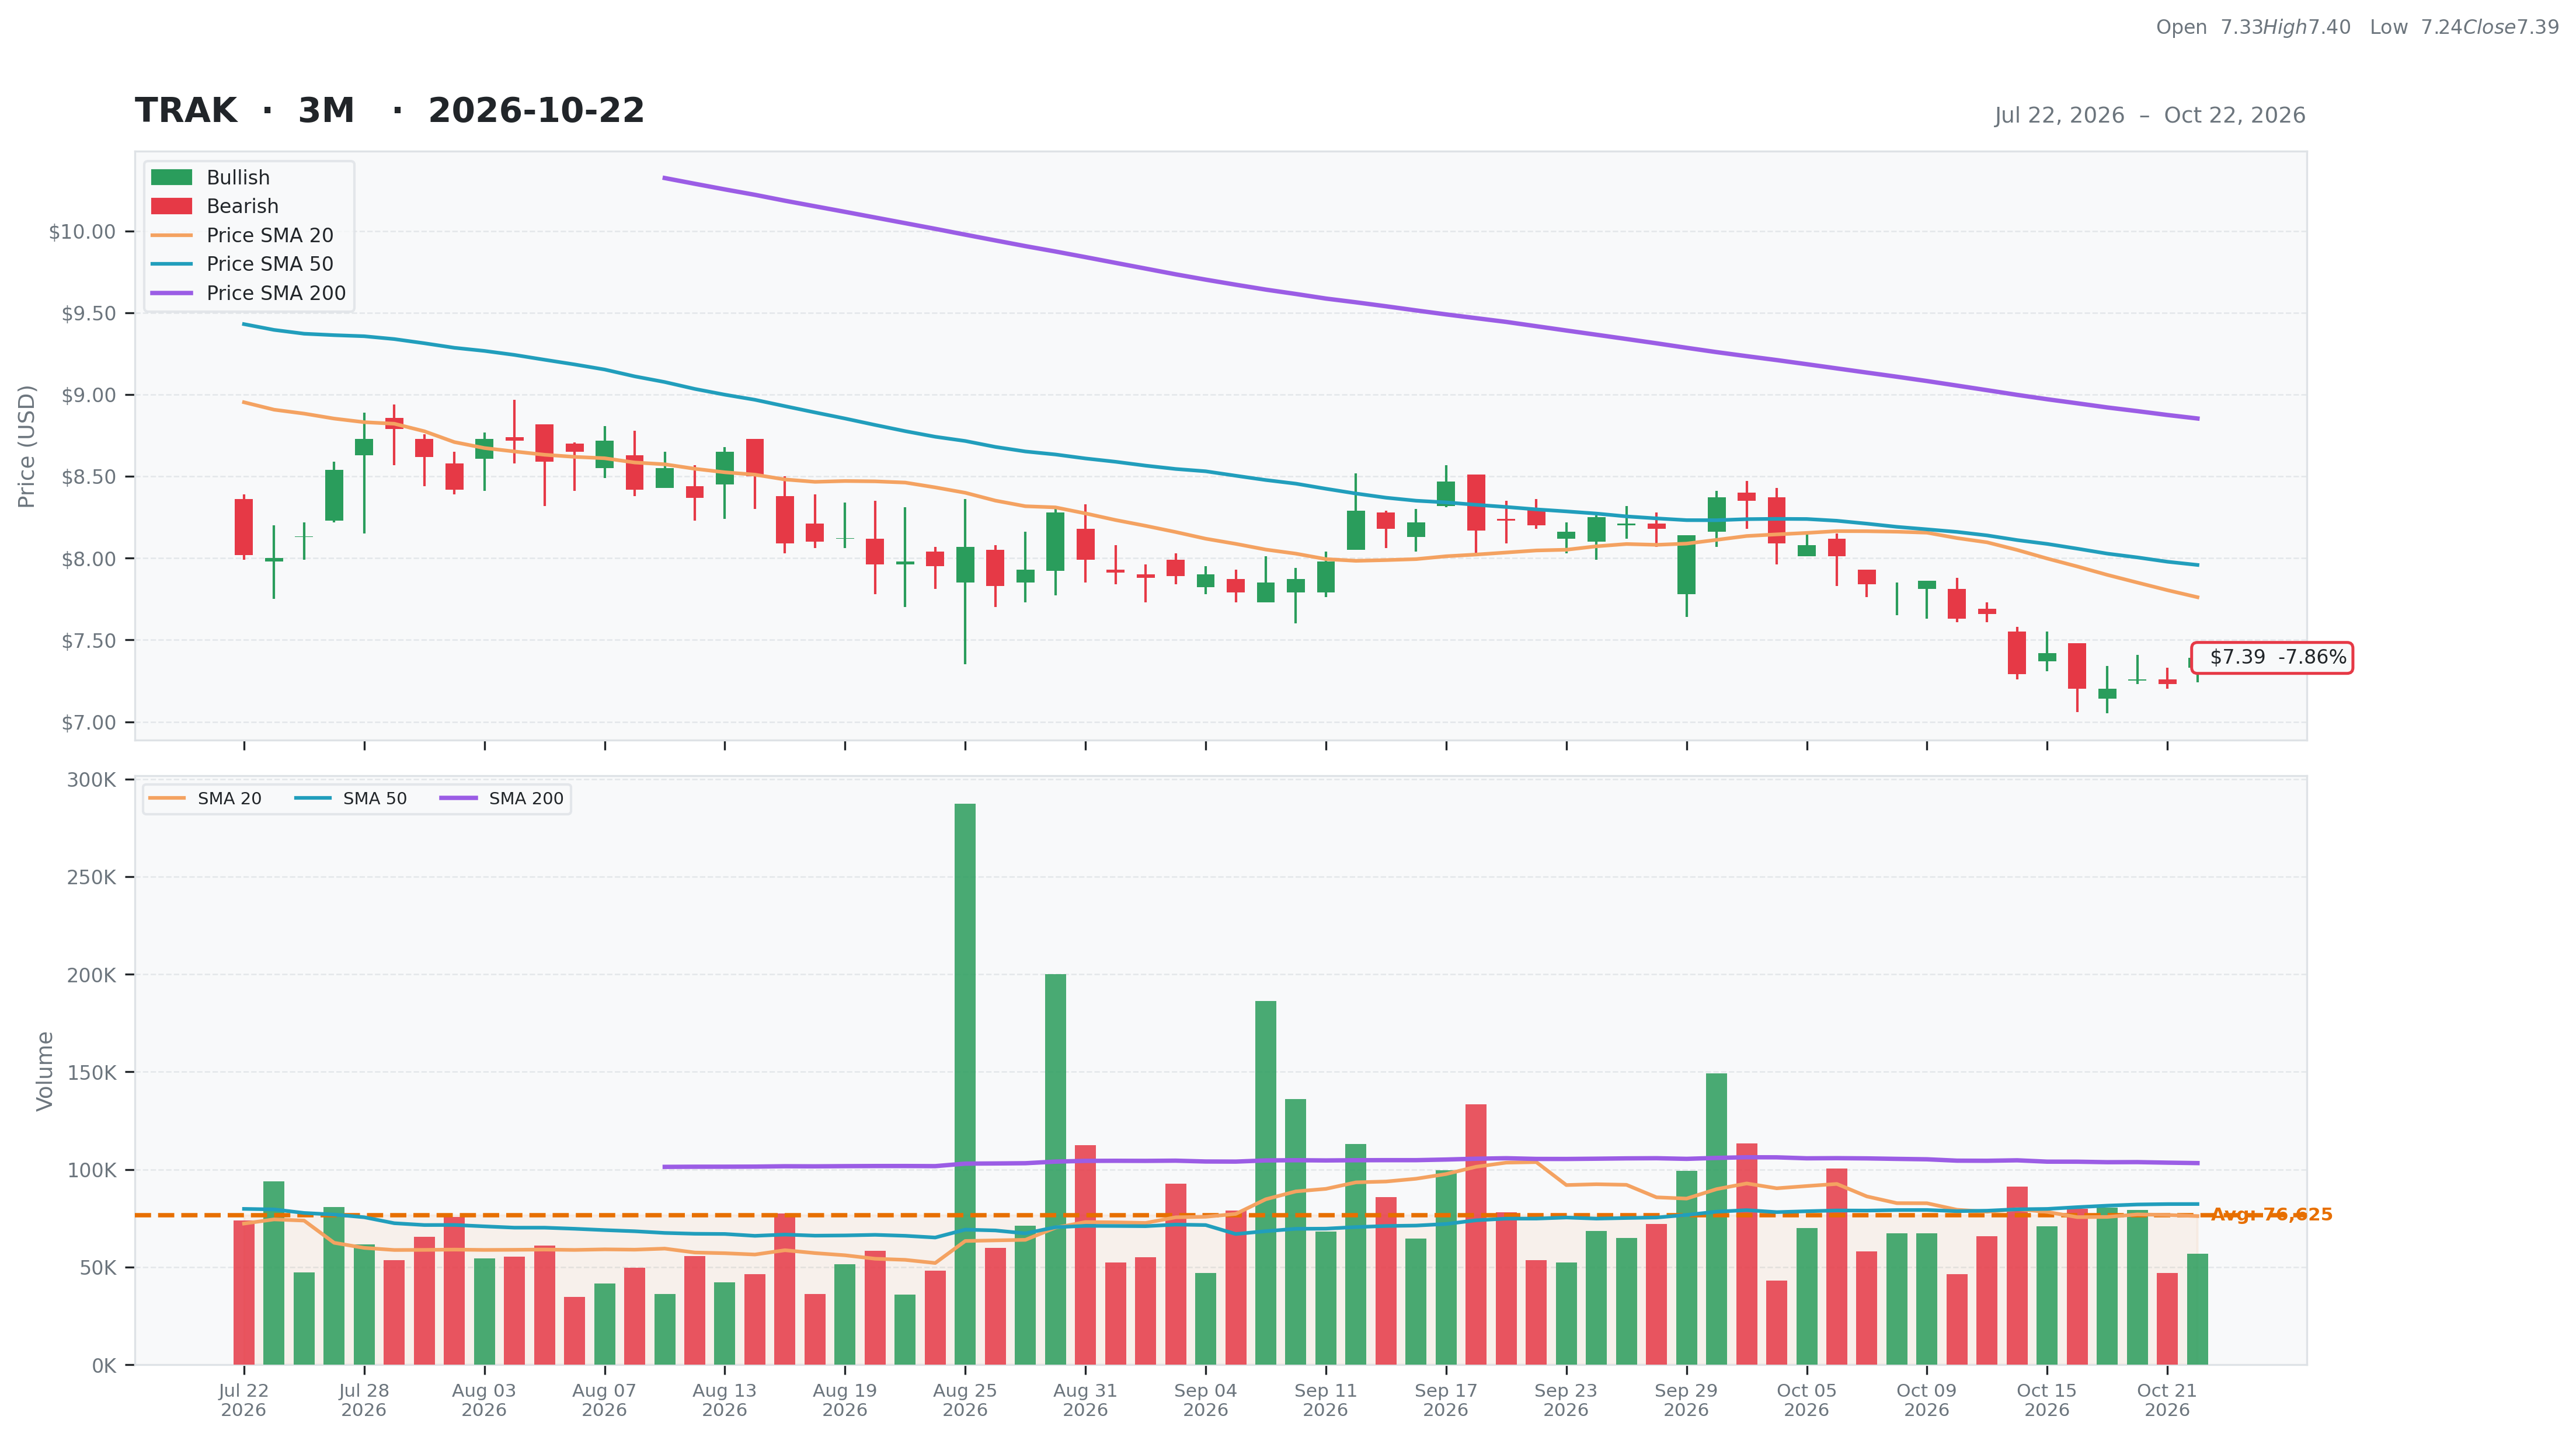
Technology • Software - Application • $7.39 • MCap: 131,048,664
https://repositrak.com • ReposiTrak, Inc., a software-as-a-service provider, operates a business-to-business, e-commerce, compliance and traceability, and supply chain management platform in North America. It offers ReposiTrak Compliance Management, which reduces potential regulatory, legal, and criminal risks from its supply chain partners; ReposiTrak Traceability Network, which captures key data elements for designated products; and ReposiTrak Supply Chain Solutions, which enable customers to manage interactions with suppliers. The company also provides business consulting services to suppliers and retailers in the grocery, convenience, and specialty retail sectors. In addition, it provides professional consulting services and sells software license. The company primarily serves multi-store retail chains, wholesalers, distributors, and their suppliers. The company was formerly known as Park City Group, Inc. and changed its name to ReposiTrak, Inc. in December 2023. ReposiTrak, Inc. is based in Murray, Utah.
ET
| Score | Price | 52 Week & Averages | Relative Strength | Risk | |||||
|---|---|---|---|---|---|---|---|---|---|
| Total | 72 | Current | $7.39 | 52W High | $15.53 -52.42% | Relative Strength | -0.21 | Beta | 0.84 |
| Business Quality | 25 | Weekly | $7.42 -0.40% | 52W Low | $7.10 4.12% | 3M | -0.09 | Short % | 0.11 |
| Financial Strength | 14 | Monthly | $8.20 -9.88% | Above 50DMA | $7.96 -7.14% | 6M | -0.02 | Risk Score | 5 |
| Growth Outlook | 8 | Quarterly | $8.13 -9.10% | Above 200DMA | $8.85 -16.53% | 9M | -0.33 | ||
| Momentum | 2 | Yearly | $15.10 -51.07% | 12M | -0.52 | ||||
| Valuation | Financial Strength | Growth/Profitability | |||
|---|---|---|---|---|---|
| Trailing P/E | 18.46 | Cash | 27M | Revenue Growth | -0.03% |
| Forward P/E | 18.46 | Debt | 0M | Earnings Growth | 0.22% |
| PEG Ratio | 0.74 | Debt/Equity | 0.56 | Qtr Earnings Growth | 0.16% |
| Price/Sales | 5.63 | Current Ratio | 3.85 | Gross Margin | 0.86% |
| Price/Book | 2.50 | Quick Ratio | 3.80 | Operating Margin | 0.34% |
| EV/Revenue | 4.47 | Operating CF | 8M | Profit Margin | 0.33% |
| EV/EBITDA | 12.57 | Free CF | 7M | EBITDA Margin | 0.36% |
| Ent Value | 104M | Return on Assets | 0.08% | ||
| Return on Equity | 0.15% | ||||
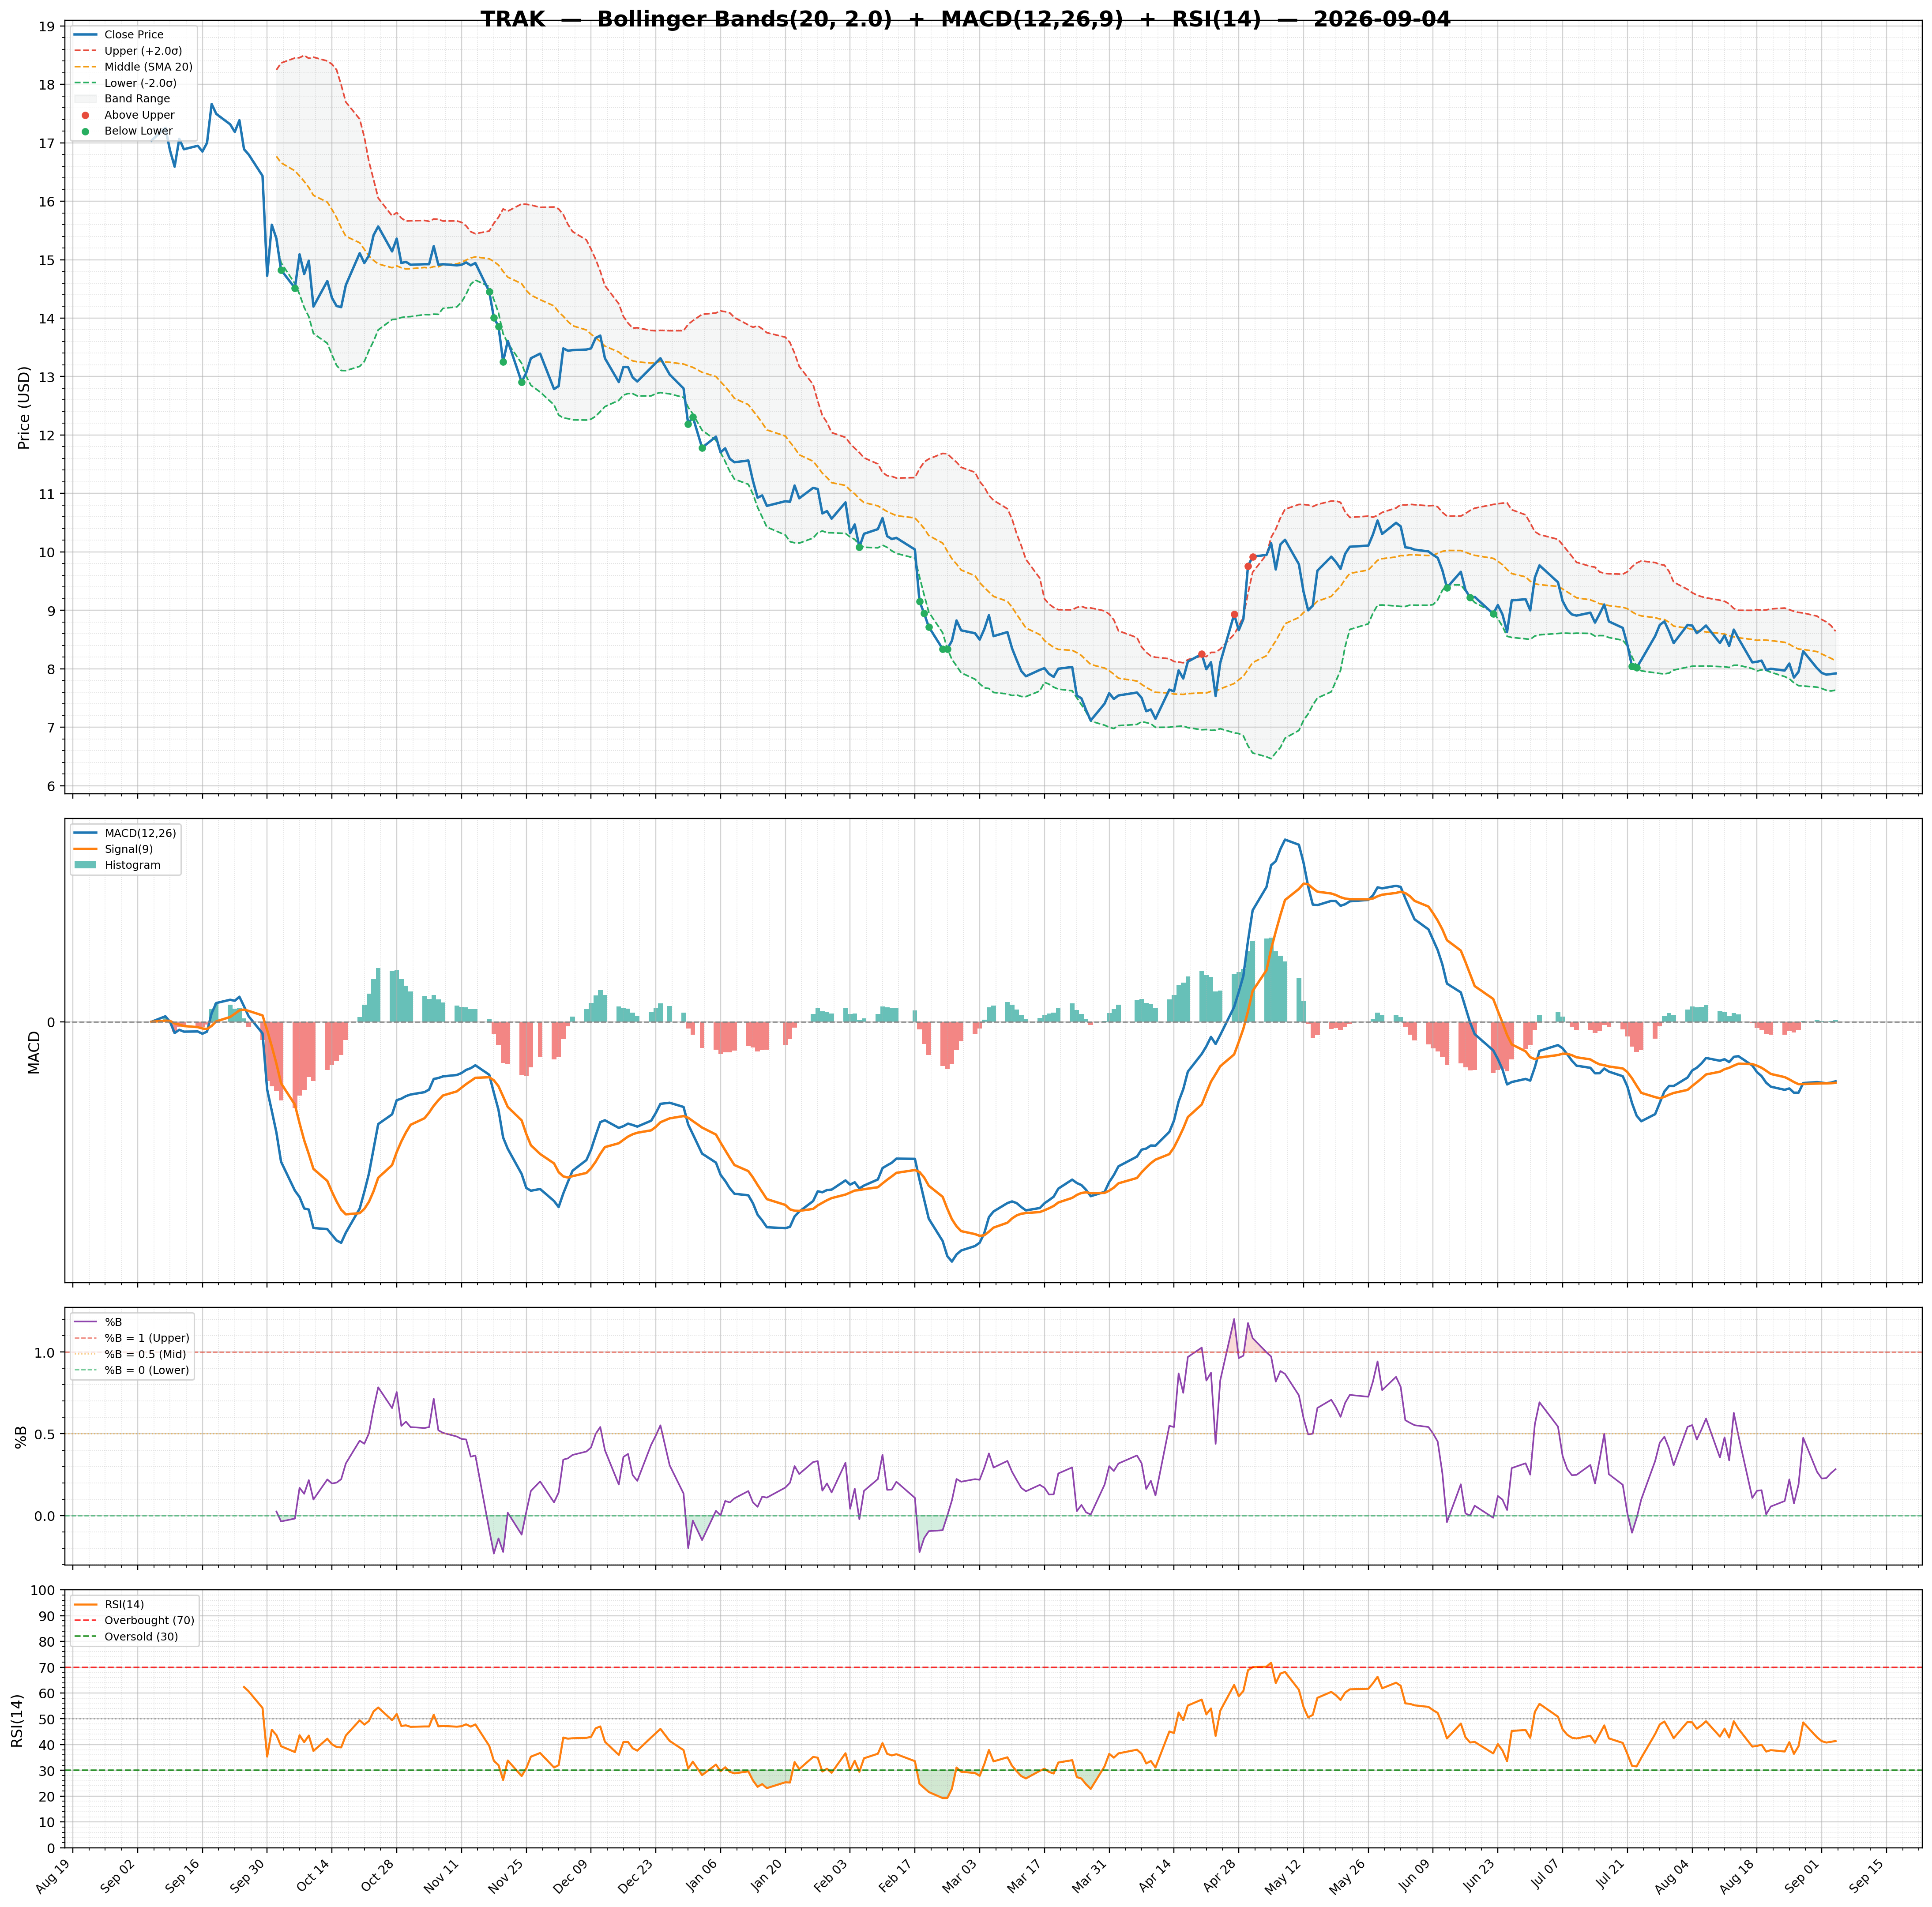
| Technical | Volume & Bollinger Bands | Analyst | |||
|---|---|---|---|---|---|
| RSI | 38.44 | Volume | 0.08M | Rating | none |
| Previous RSI | 31.66 | Avg Volume 20D | 0.08M | Target Mean | $16.00 |
| RSI Trend | Up | Relative Volume | 0.73 | Target High | $16.00 |
| MACD | -0.24 | Lower Band | 6.94 | Target Low | $16.00 |
| MACD Signal | -0.19 | Middle Band | 7.76 | Target Median | $16.00 |
| Histogram | -0.05 | Upper Band | 8.58 | Analysts | 1 |
| Previous Histogram | -0.07 | Bandwidth | 21.130 | Upside | 122.22% |
| Histogram Trend | Increasing | %B | 0.27 | ||