LendingTree, Inc. (TREE)
Financial Services • Insurance Brokers • $27.56 • MCap: 356,464,448
https://www.lendingtree.com • LendingTree, Inc., through its subsidiary, operates online consumer platform in the United States. The company operates through three segments: Home, Consumer, and Insurance. The Home segments offer purchase mortgage, refinance mortgage, and home equity loans and lines of credit. The Consumer segment provides credit cards; personal, small business, and auto loans; deposit accounts; and other credit products, such as debt settlement services. The Insurance segment includes information, tools, and access to insurance quote products, including automobile, home, life, and health and Medicare through which consumers are matched with insurance lead aggregators to obtain insurance offers and policies. This segment also offers QuoteWizard, a marketplace for insurance comparison; and ValuePenguin, a personal finance website that offers consumers objective analysis on various financial topics. The company was formerly known as Tree.com, Inc. and changed its name to LendingTree, Inc. in January 2015. LendingTree, Inc. was incorporated in 1996 and is based in Charlotte, North Carolina.
ET
| Score | Price | 52 Week & Averages | Relative Strength | Risk | |||||
|---|---|---|---|---|---|---|---|---|---|
| Total | 53 | Current | $27.56 | 52W High | $68.01 -59.48% | Relative Strength | -0.43 | Beta | 2.05 |
| Business Quality | 17 | Weekly | $25.82 6.74% | 52W Low | $24.00 14.83% | 3M | -0.29 | Short % | 0.08 |
| Financial Strength | 17 | Monthly | $26.05 5.80% | Above 50DMA | $27.06 1.85% | 6M | -0.41 | Risk Score | 3 |
| Growth Outlook | 1 | Quarterly | $39.00 -29.33% | Above 200DMA | $39.07 -29.46% | 9M | -0.59 | ||
| Momentum | 2 | Yearly | $61.45 -55.15% | 12M | -0.56 | ||||
| Valuation | Financial Strength | Growth/Profitability | |||
|---|---|---|---|---|---|
| Trailing P/E | 1.96 | Cash | 111M | Revenue Growth | 0.25% |
| Forward P/E | 3.83 | Debt | 436M | Earnings Growth | 0.05% |
| PEG Ratio | 3.55 | Debt/Equity | 135.94 | Qtr Earnings Growth | 0.08% |
| Price/Sales | 0.28 | Current Ratio | 1.85 | Gross Margin | 0.96% |
| Price/Book | 1.11 | Quick Ratio | 1.76 | Operating Margin | 0.08% |
| EV/Revenue | 0.54 | Operating CF | 86M | Profit Margin | 0.14% |
| EV/EBITDA | 5.80 | Free CF | 63M | EBITDA Margin | 0.09% |
| Ent Value | 682M | Return on Assets | 0.08% | ||
| Return on Equity | 0.83% | ||||
| Technical | Volume & Bollinger Bands | Analyst | |||
|---|---|---|---|---|---|
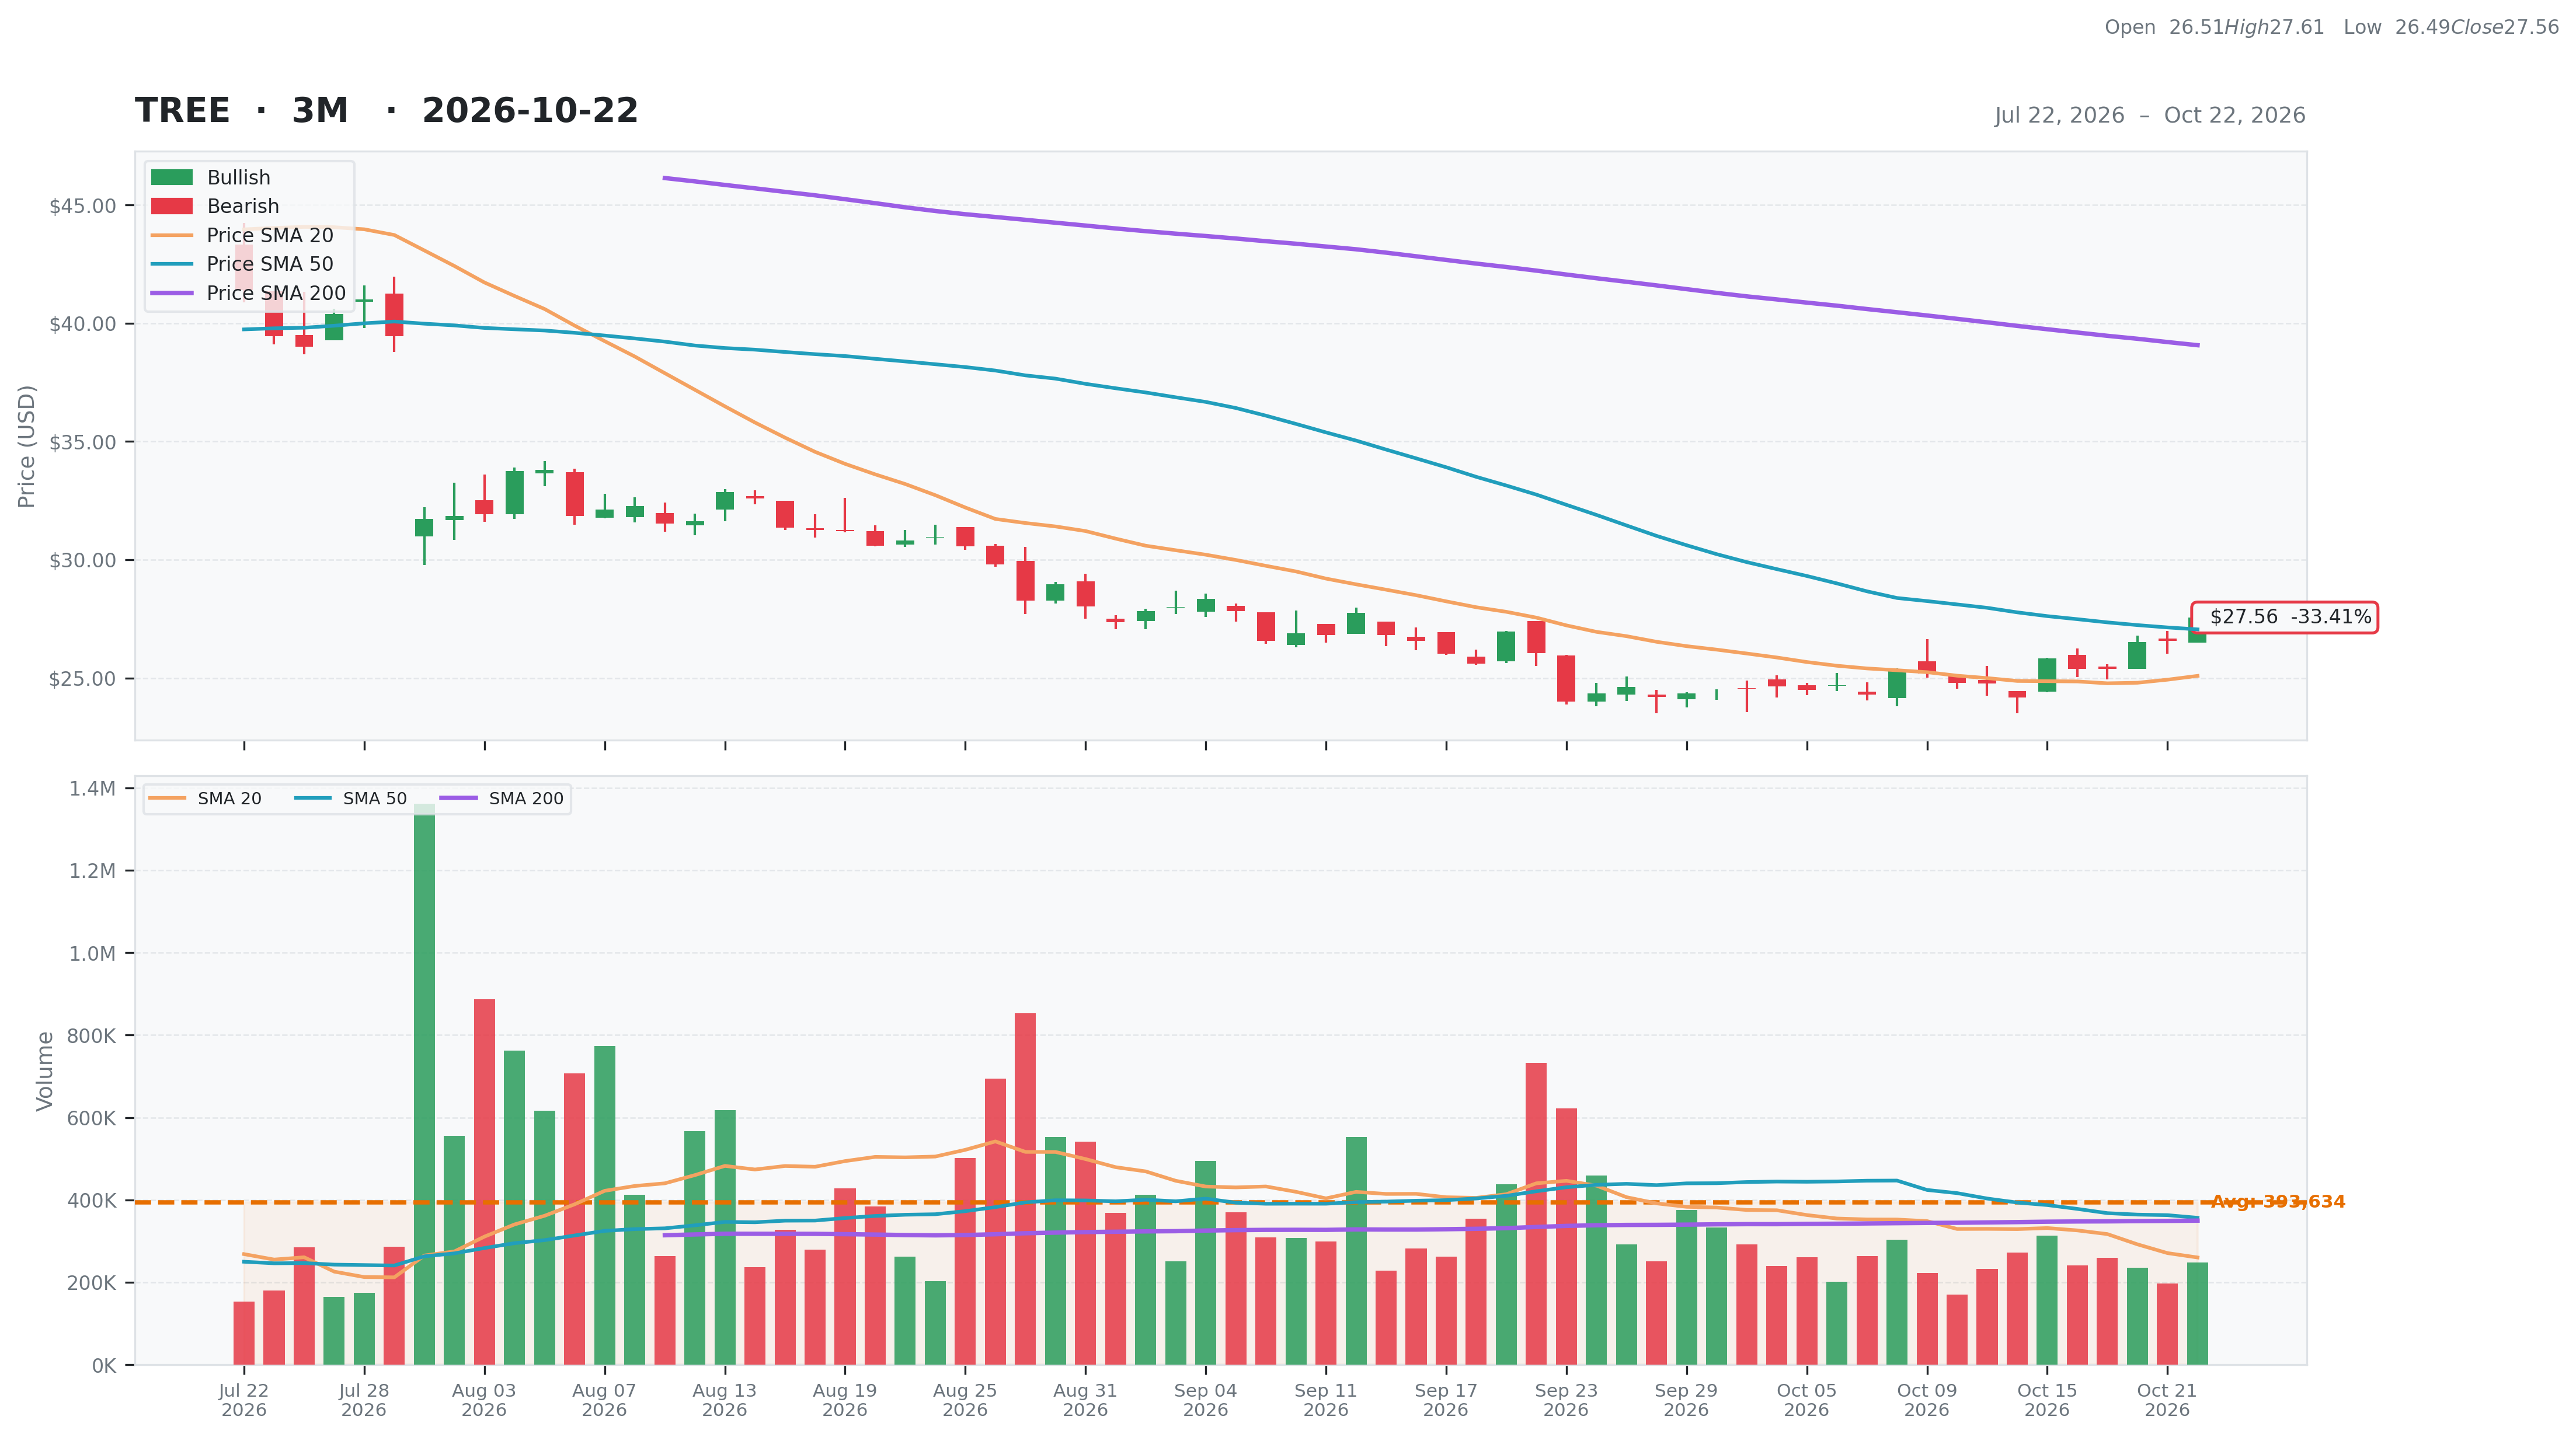
| RSI | 60.60 | Volume | 0.24M | Rating | none |
| Previous RSI | 54.91 | Avg Volume 20D | 0.26M | Target Mean | $56.00 |
| RSI Trend | Up | Relative Volume | 0.79 | Target High | $70.00 |
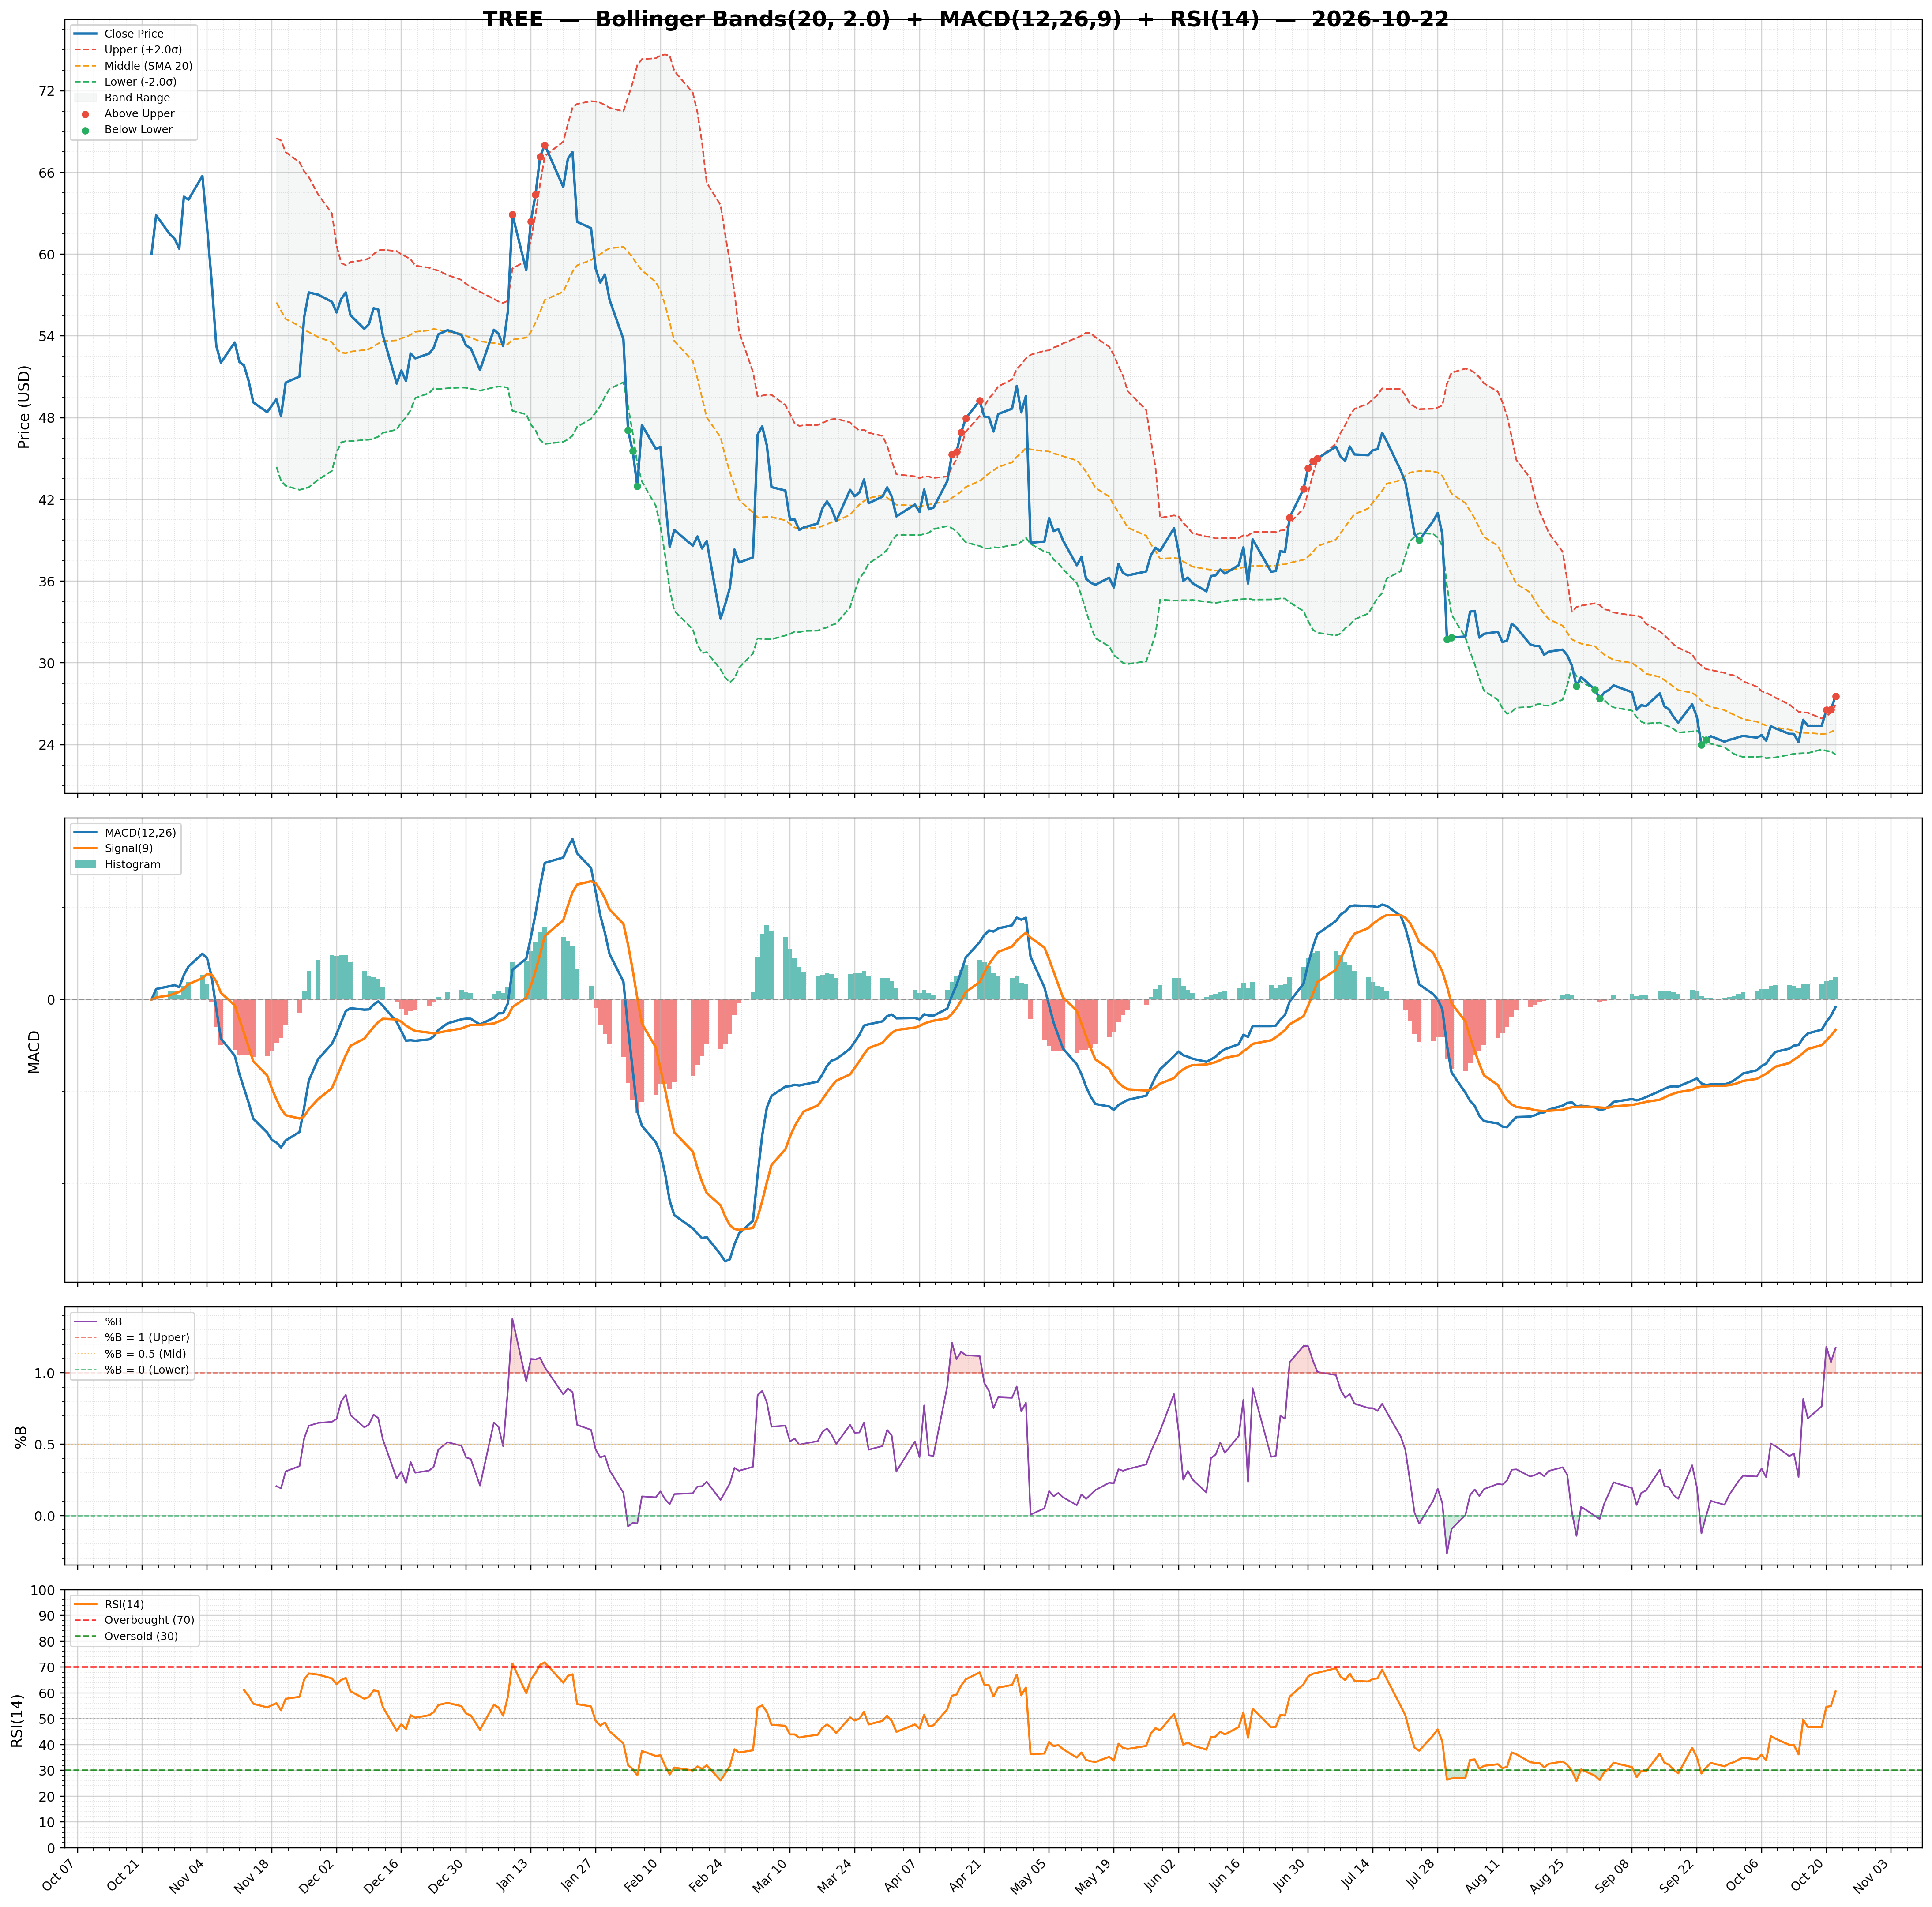
| MACD | -0.16 | Lower Band | 23.27 | Target Low | $45.00 |
| MACD Signal | -0.66 | Middle Band | 25.09 | Target Median | $56.50 |
| Histogram | 0.50 | Upper Band | 26.92 | Analysts | 6 |
| Previous Histogram | 0.43 | Bandwidth | 14.540 | Upside | 120.56% |
| Histogram Trend | Increasing | %B | 1.18 | ||