Trimble Inc. (TRMB)
Technology • Scientific & Technical Instruments • $64.01 • MCap: 13,864,872,960
https://www.trimble.com • Trimble Inc. offers technology solutions and platform that enable office professionals and field workers to connect workflows and industry lifecycles in North America, Europe, the Asia Pacific, and internationally. The company provides architecture and interior design; building information modeling, engineering, and virtual design and construction; and construction and owner software products. It also offers field and office software for estimating and job cost management, and project design and visualization; software for 3D design and data sharing; systems to guide and control construction equipment, such as excavators, bulldozers, wheel loaders, motor graders, and paving equipment; systems to monitor, track, and manage assets, equipment, and workers; and software to facilitate the management of the construction process and for sharing and communication of data in real time. In addition, it provides positioning services comprising VRSNow; CenterPoint RTX; FieldPoint RTX; Rangepoint RTX; ViewPoint RTX; and Trimble xFill services. Further, it offers transportation and logistics solutions for shippers, carriers, retailers, and intermediaries, such as carrier transportation management software (TMS) and maintenance solutions to manage core transportation operations and maintenance workflows; transporeon solutions to provide a cloud-based ecosystem that manages the transportation lifecycle from freight sourcing and procurement through transport execution, dock and yard management, and auditing; and MAPS, a mapping and routing solutions that provide the industry standard for truck-specific routing, mileage, and navigation. It sells its technology solutions directly to end users and through software integrations. The company was formerly known as Trimble Navigation Limited and changed its name to Trimble Inc. in October 2016. Trimble Inc. was founded in 1978 and is headquartered in Westminster, Colorado.
Watch List
| Score | Price | 52 Week & Averages | Relative Strength | Risk | |||||
|---|---|---|---|---|---|---|---|---|---|
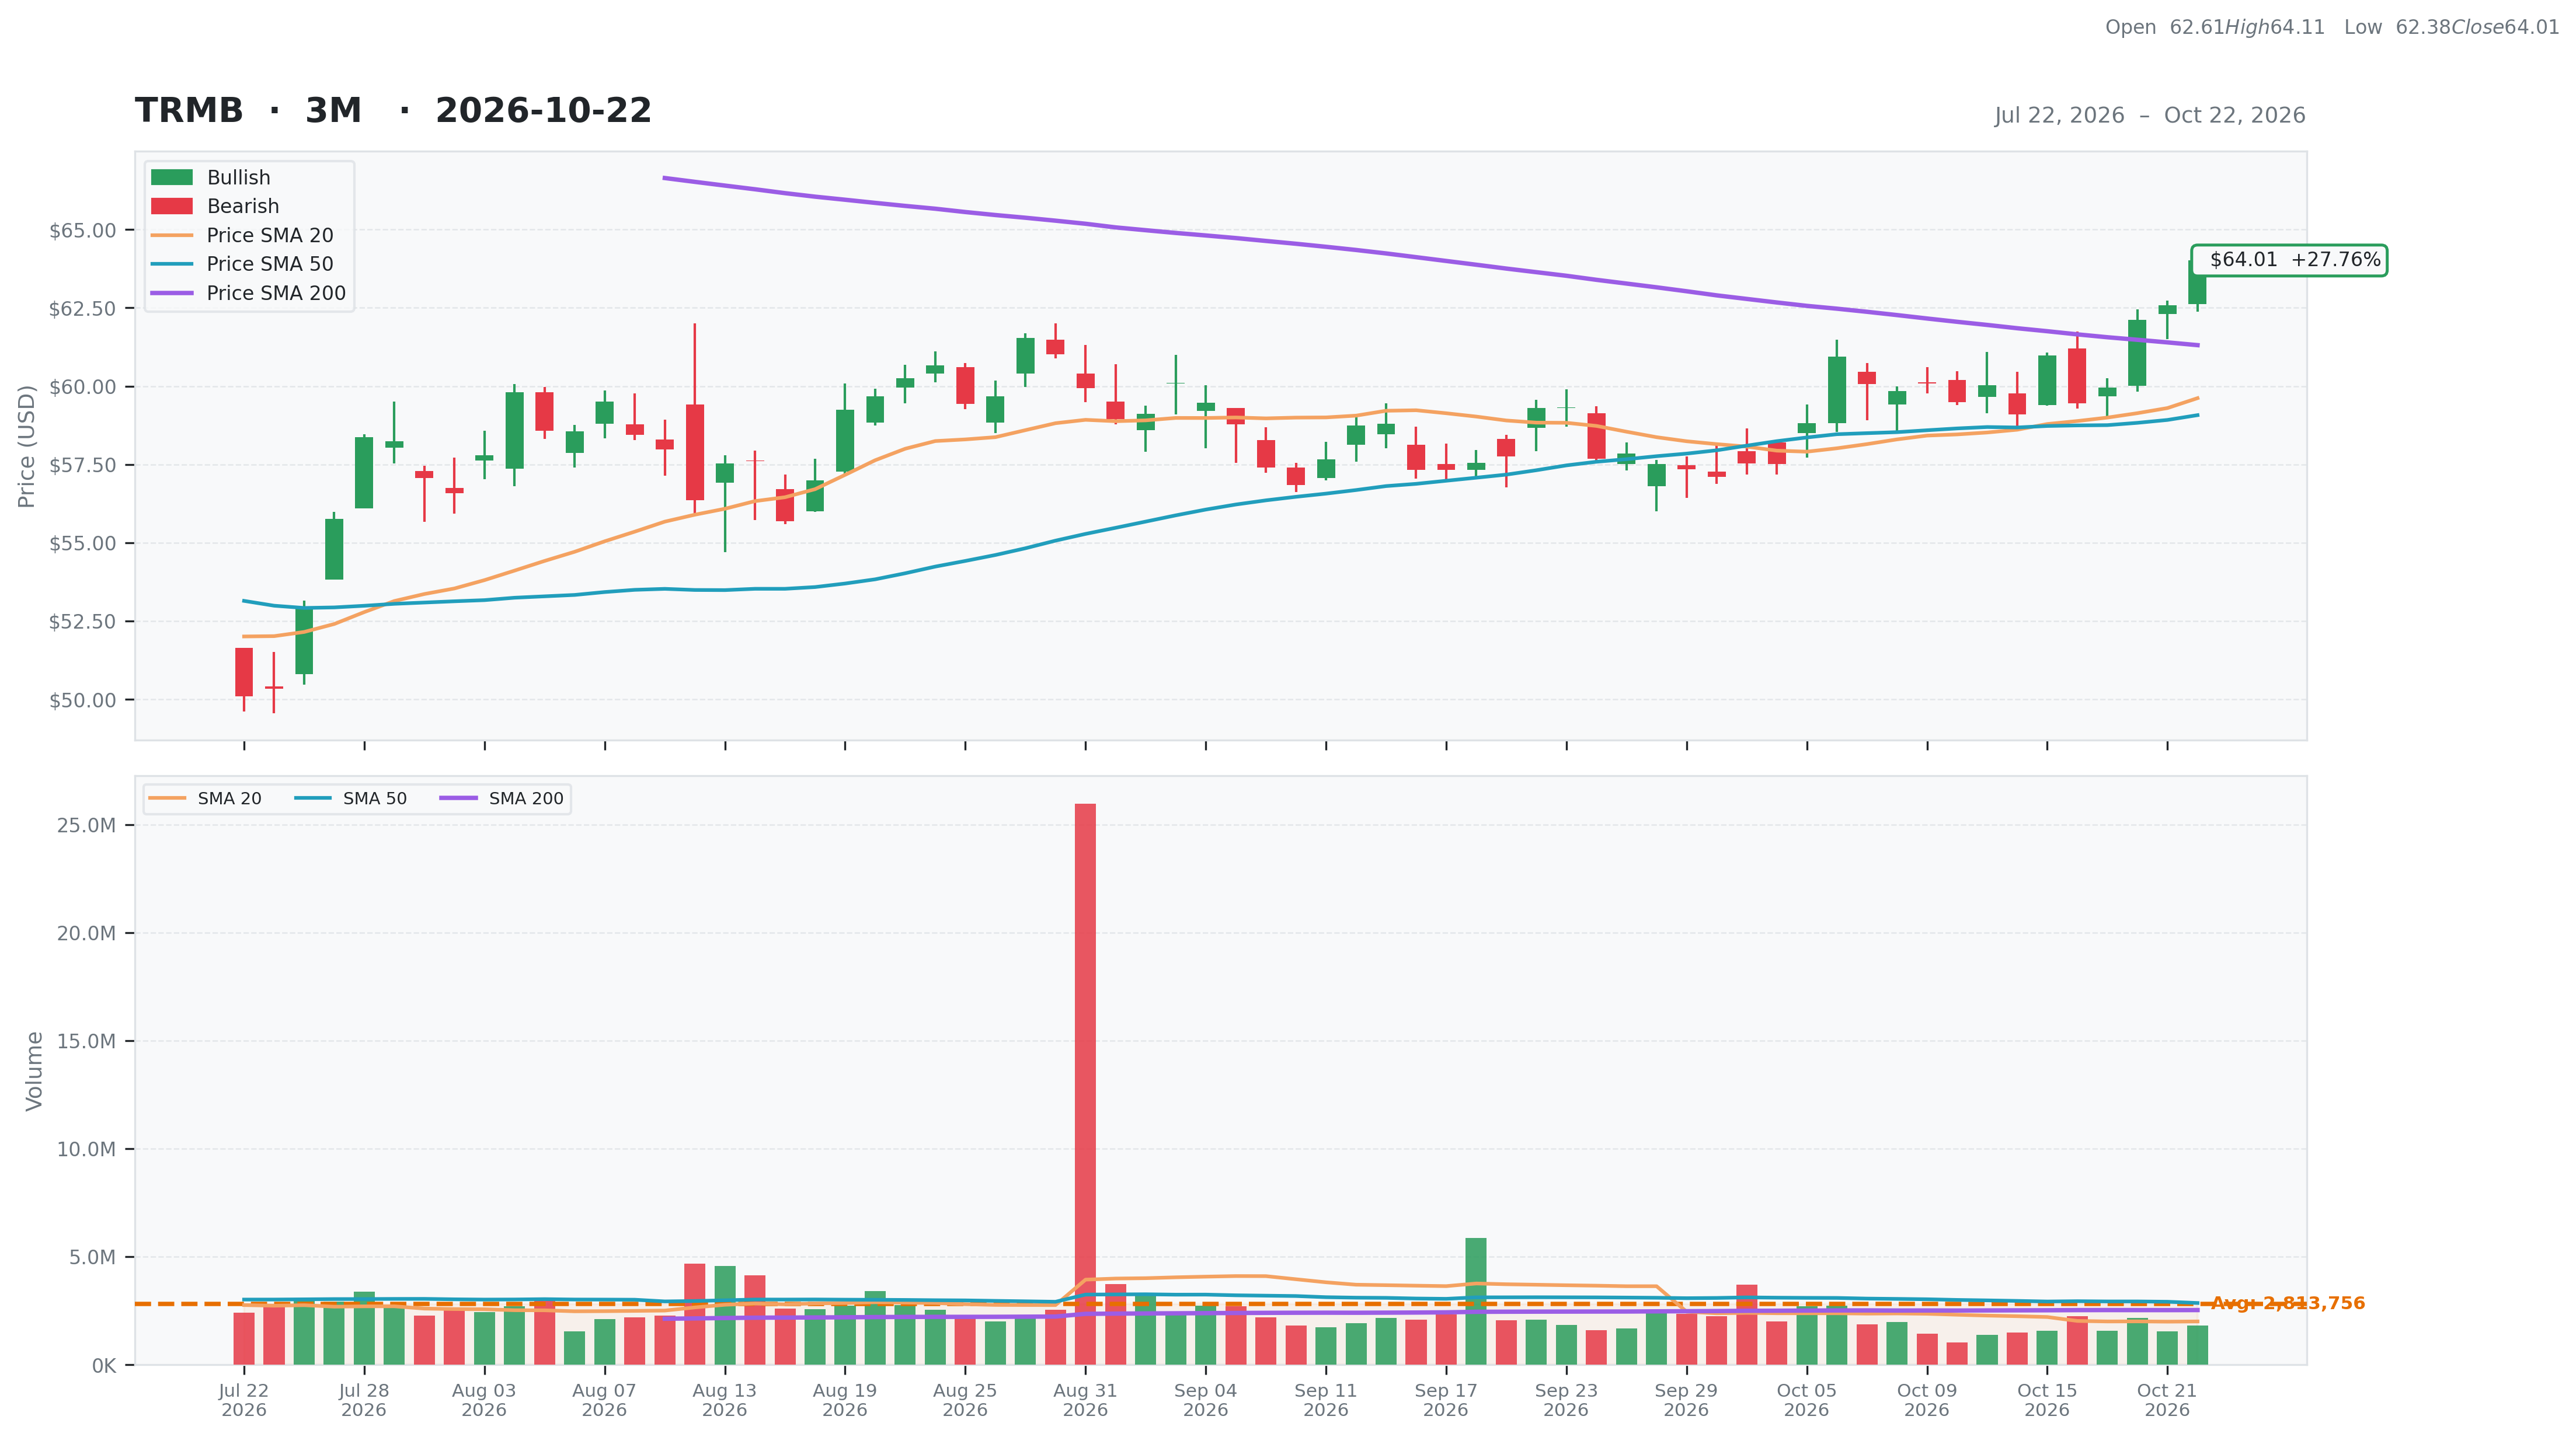
| Total | 52 | Current | $64.01 | 52W High | $83.52 -23.36% | Relative Strength | 0.01 | Beta | 1.34 |
| Business Quality | 15 | Weekly | $60.97 4.99% | 52W Low | $48.87 30.98% | 3M | 0.21 | Short % | 0.05 |
| Financial Strength | 12 | Monthly | $59.30 7.94% | Above 50DMA | $59.07 8.36% | 6M | -0.05 | Risk Score | 4 |
| Growth Outlook | 1 | Quarterly | $52.91 20.98% | Above 200DMA | $61.31 4.41% | 9M | -0.10 | ||
| Momentum | 5 | Yearly | $81.12 -21.09% | 12M | -0.21 | ||||
| Valuation | Financial Strength | Growth/Profitability | |||
|---|---|---|---|---|---|
| Trailing P/E | N/A | Cash | 214M | Revenue Growth | 0.11% |
| Forward P/E | 14.37 | Debt | 1,459M | Earnings Growth | N/A |
| PEG Ratio | 1.44 | Debt/Equity | 28.55 | Qtr Earnings Growth | N/A |
| Price/Sales | 3.67 | Current Ratio | 0.95 | Gross Margin | 0.72% |
| Price/Book | 2.71 | Quick Ratio | 0.58 | Operating Margin | 0.15% |
| EV/Revenue | 3.99 | Operating CF | 799M | Profit Margin | -0.03% |
| EV/EBITDA | 17.17 | Free CF | 686M | EBITDA Margin | 0.23% |
| Ent Value | 15,110M | Return on Assets | 0.05% | ||
| Return on Equity | -0.02% | ||||
| Technical | Volume & Bollinger Bands | Analyst | |||
|---|---|---|---|---|---|
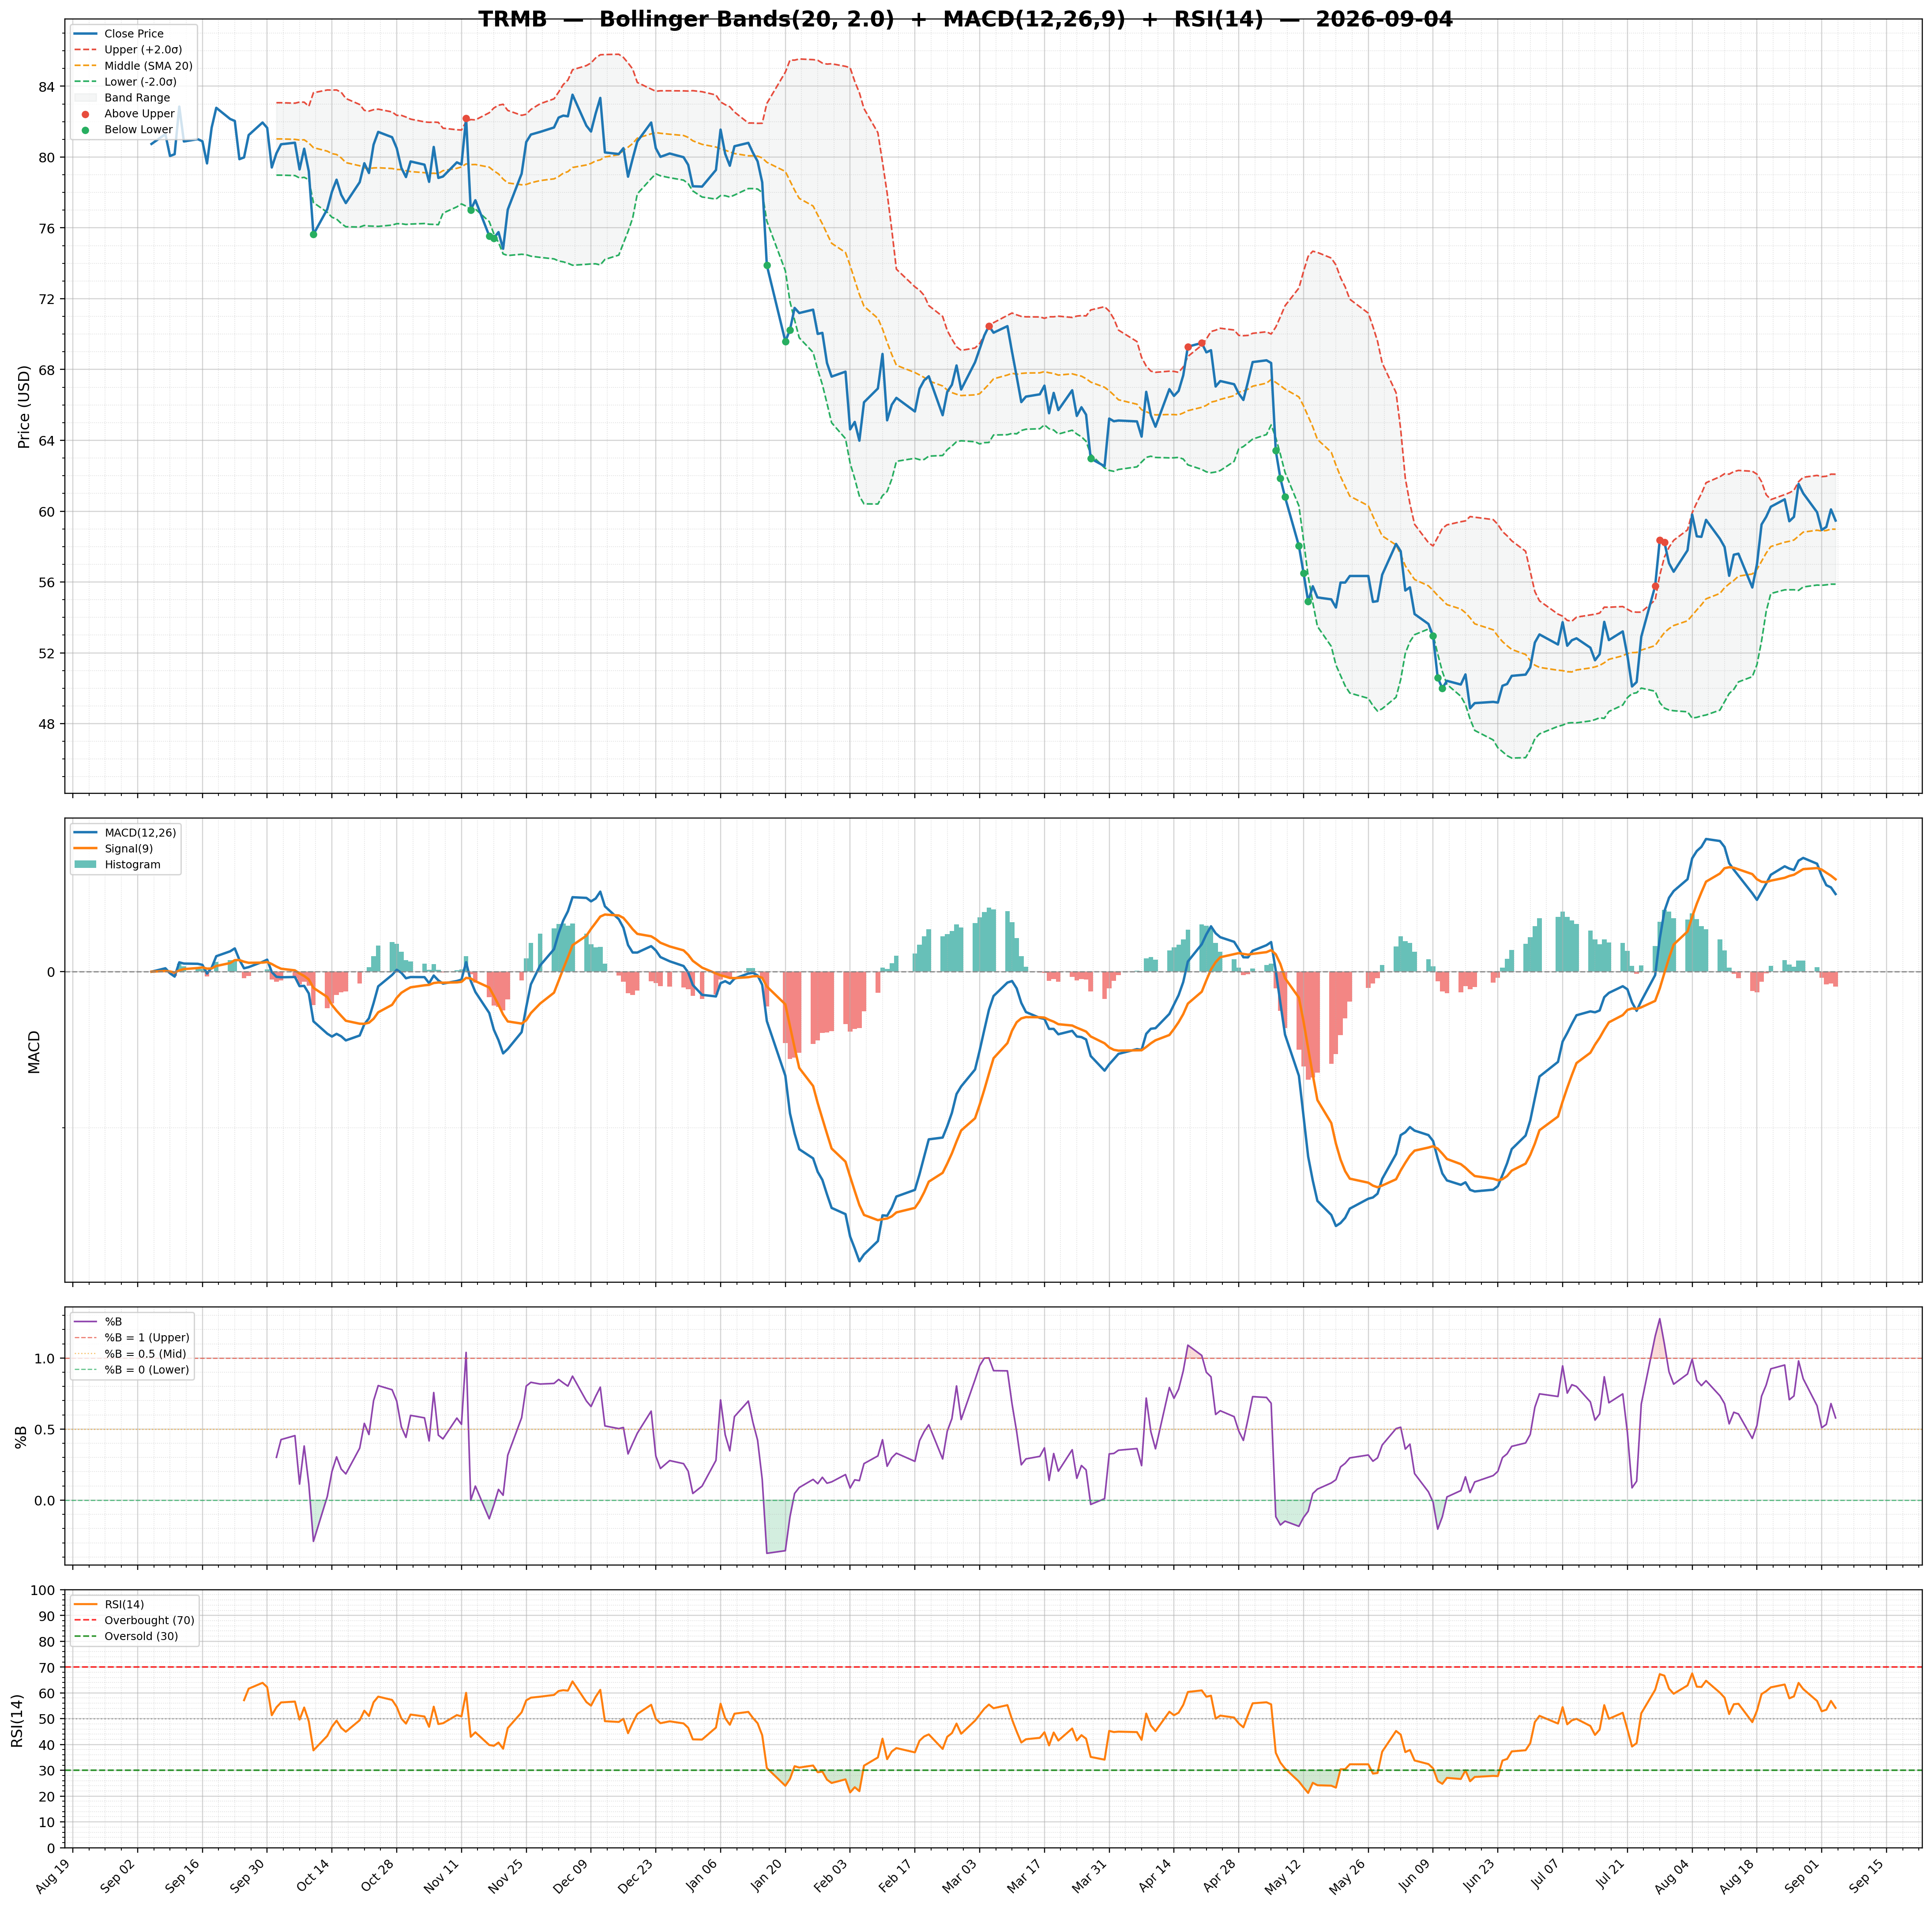
| RSI | 67.70 | Volume | 2.25M | Rating | strong_buy |
| Previous RSI | 63.66 | Avg Volume 20D | 2M | Target Mean | $79.40 |
| RSI Trend | Up | Relative Volume | 0.85 | Target High | $94.00 |
| MACD | 1.05 | Lower Band | 55.85 | Target Low | $61.00 |
| MACD Signal | 0.63 | Middle Band | 59.62 | Target Median | $80.00 |
| Histogram | 0.42 | Upper Band | 63.39 | Analysts | 10 |
| Previous Histogram | 0.30 | Bandwidth | 12.650 | Upside | 33.54% |
| Histogram Trend | Increasing | %B | 1.08 | ||