Townsquare Media, Inc. (TSQ)
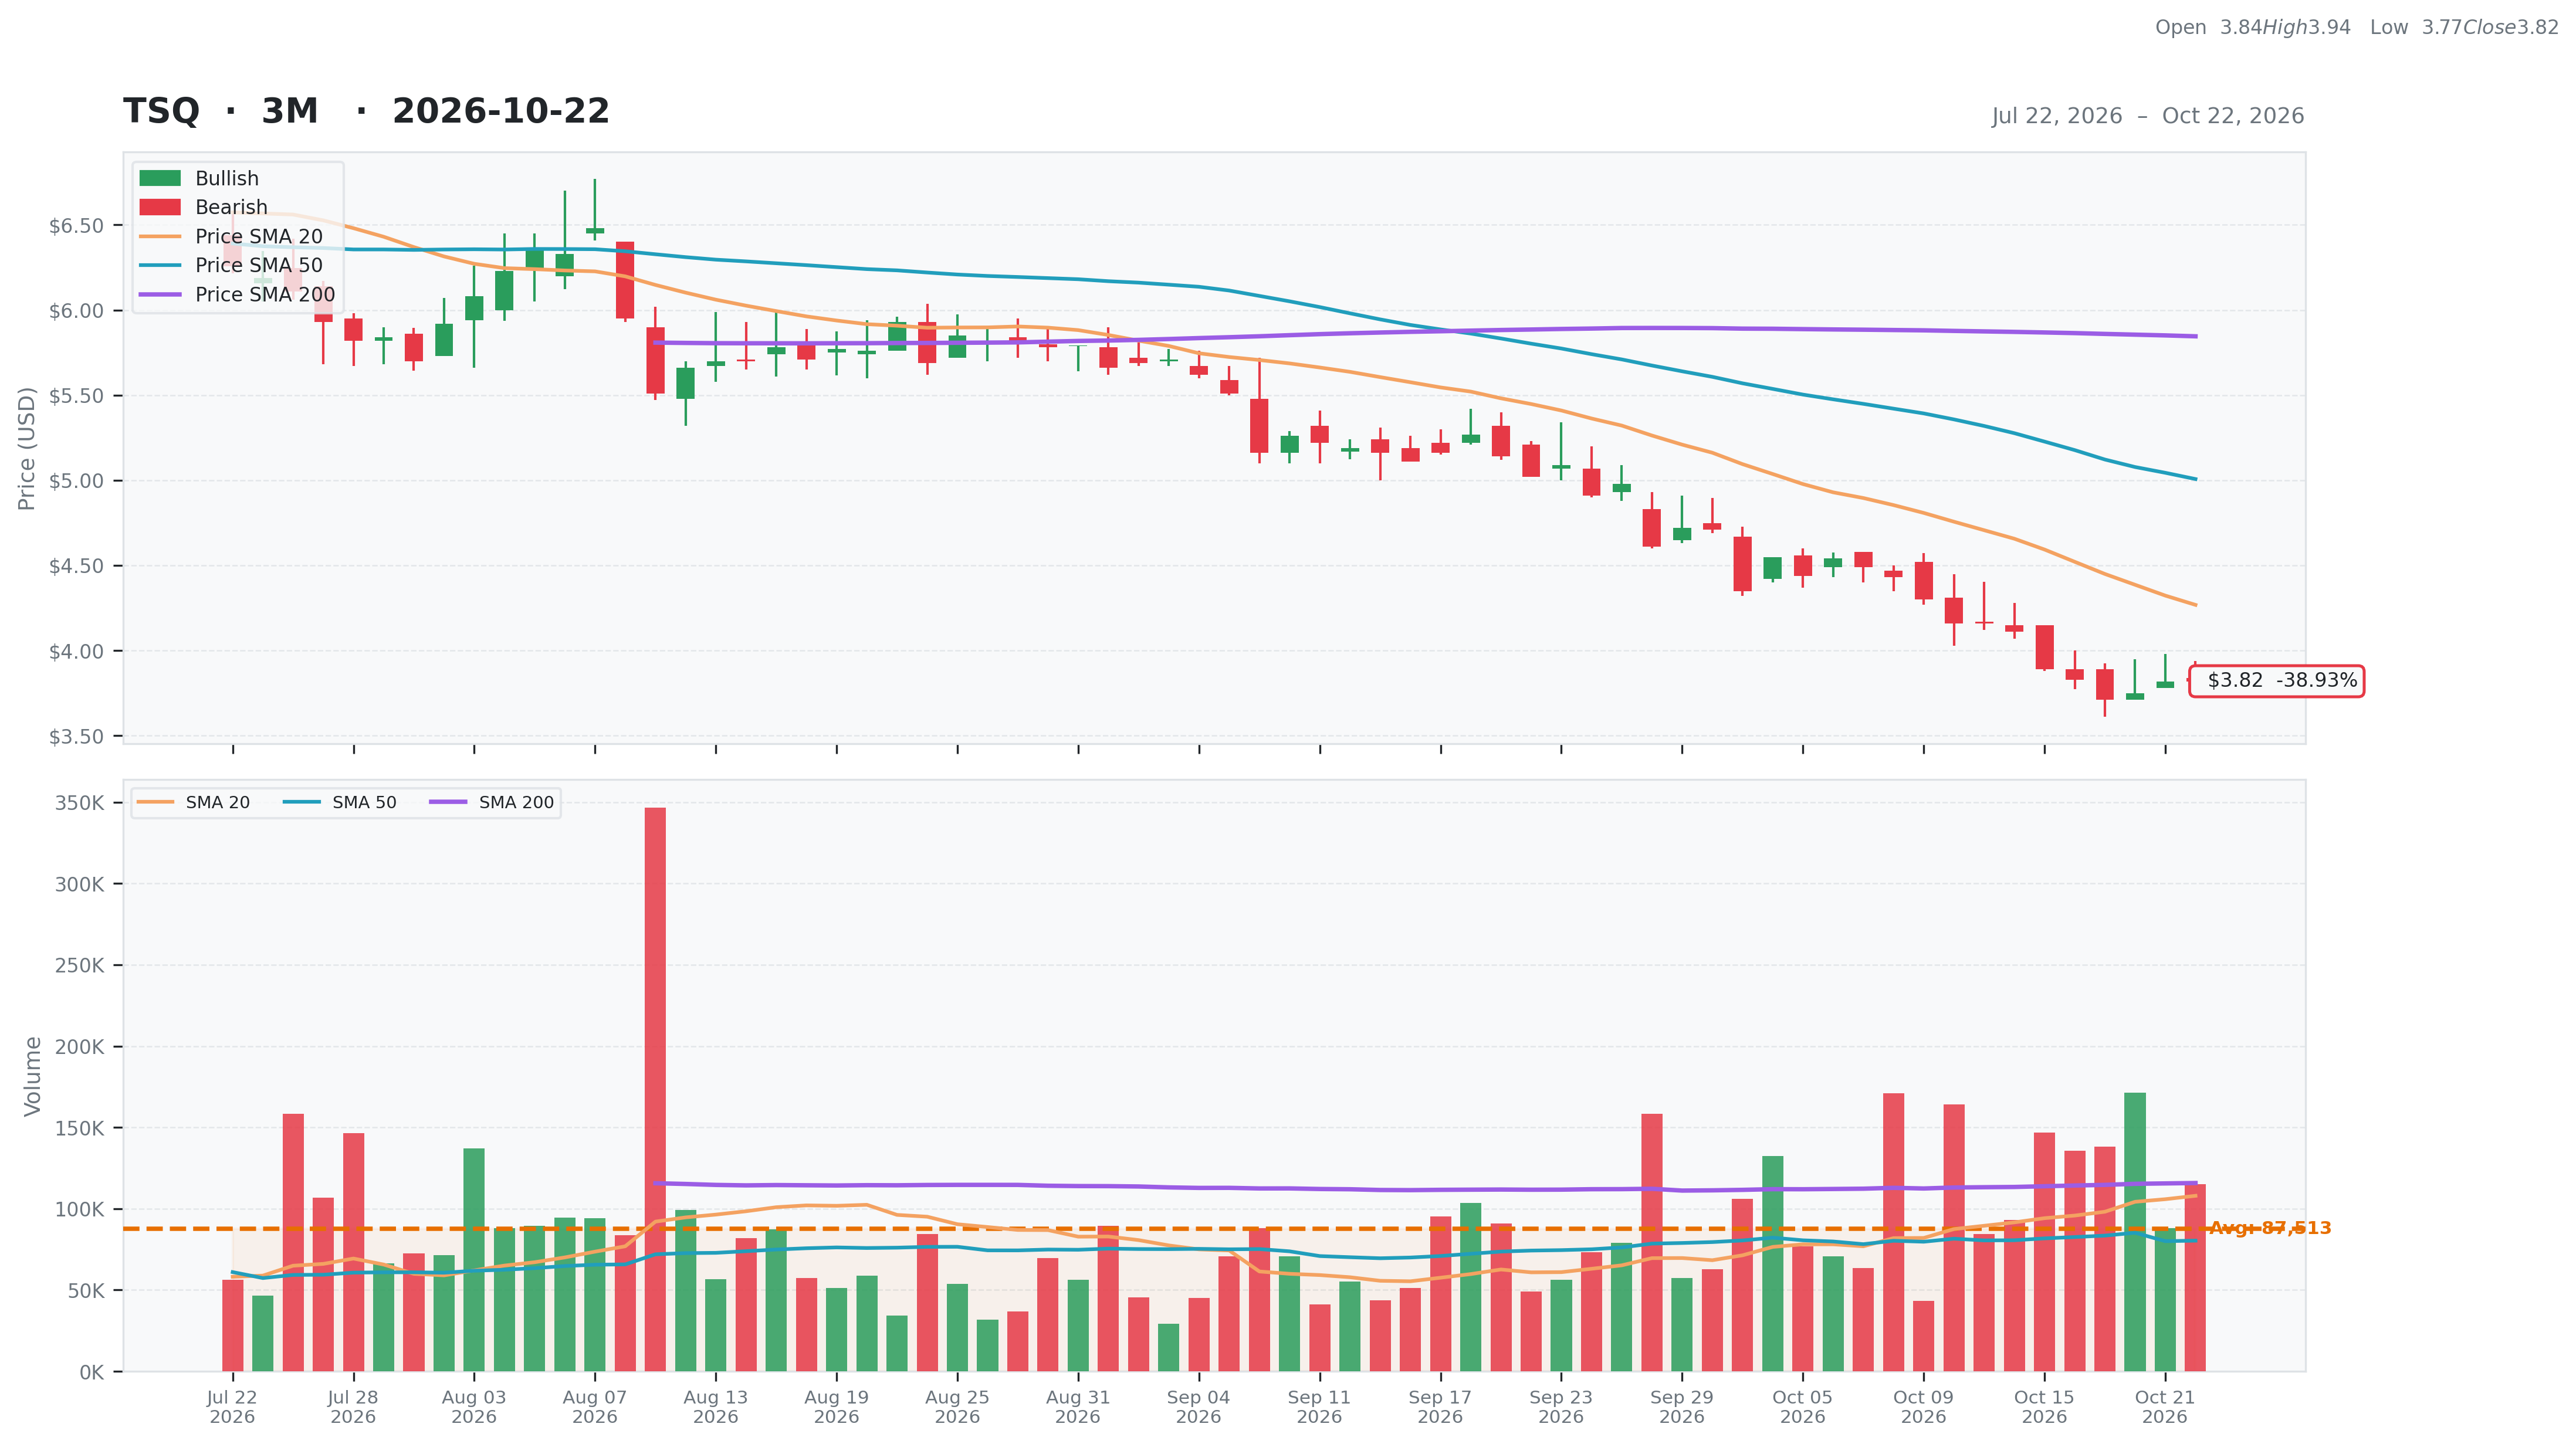
Communication Services • Advertising Agencies • $3.82 • MCap: 69,827,176
https://www.townsquaremedia.com • Townsquare Media, Inc., together with its subsidiaries, operates as a digital and broadcast media, and digital marketing solutions company for small and medium-sized businesses in the United States. It operates through Subscription Digital Marketing Solutions, Digital Advertising, Broadcast Advertising, and Other segments. The Subscription Digital Marketing Solutions segment offers Townsquare Business Management Platform, a SAAS solution that provides website design, creation, and development, as well as hosting services; and search engine optimization, online directory optimization, e-commerce solutions, online reputation monitoring, social media management, appointment scheduling, payment and invoice, customer relationship management, and email and SMS marketing services. Its Digital Advertising segment provides digital advertising on its owned and operated, digital programmatic advertising, and data analytics and management platform. The Broadcast Advertising segment engages in the sale of advertising on local radio stations to local, regional, and national spot advertisers, as well as national network advertisers. Its Other segment owns and operates live events, including concerts, expositions, and other experiential events. The company was formerly known as Regent Communications, Inc. and changed its name to Townsquare Media, Inc. in May 2010. Townsquare Media, Inc. is headquartered in Purchase, New York.
Ex-AAII
| Score | Price | 52 Week & Averages | Relative Strength | Risk | |||||
|---|---|---|---|---|---|---|---|---|---|
| Total | 46 | Current | $3.82 | 52W High | $7.25 -47.29% | Relative Strength | -0.37 | Beta | 1.25 |
| Business Quality | 9 | Weekly | $3.89 -1.80% | 52W Low | $3.71 2.96% | 3M | -0.37 | Short % | 0.02 |
| Financial Strength | 8 | Monthly | $5.02 -23.90% | Above 50DMA | $5.01 -23.71% | 6M | -0.40 | Risk Score | |
| Growth Outlook | 1 | Quarterly | $6.11 -37.48% | Above 200DMA | $5.85 -34.65% | 9M | -0.31 | ||
| Momentum | 2 | Yearly | $5.80 -34.11% | 12M | -0.36 | ||||
| Valuation | Financial Strength | Growth/Profitability | |||
|---|---|---|---|---|---|
| Trailing P/E | N/A | Cash | 1M | Revenue Growth | 0.00% |
| Forward P/E | 14.19 | Debt | 488M | Earnings Growth | N/A |
| PEG Ratio | 0.56 | Debt/Equity | N/A | Qtr Earnings Growth | N/A |
| Price/Sales | 0.16 | Current Ratio | 0.93 | Gross Margin | 0.22% |
| Price/Book | -0.85 | Quick Ratio | 0.76 | Operating Margin | 0.14% |
| EV/Revenue | 1.31 | Operating CF | 28M | Profit Margin | -0.12% |
| EV/EBITDA | 7.78 | Free CF | 29M | EBITDA Margin | 0.17% |
| Ent Value | 559M | Return on Assets | 0.06% | ||
| Return on Equity | N/A | ||||
| Technical | Volume & Bollinger Bands | Analyst | |||
|---|---|---|---|---|---|
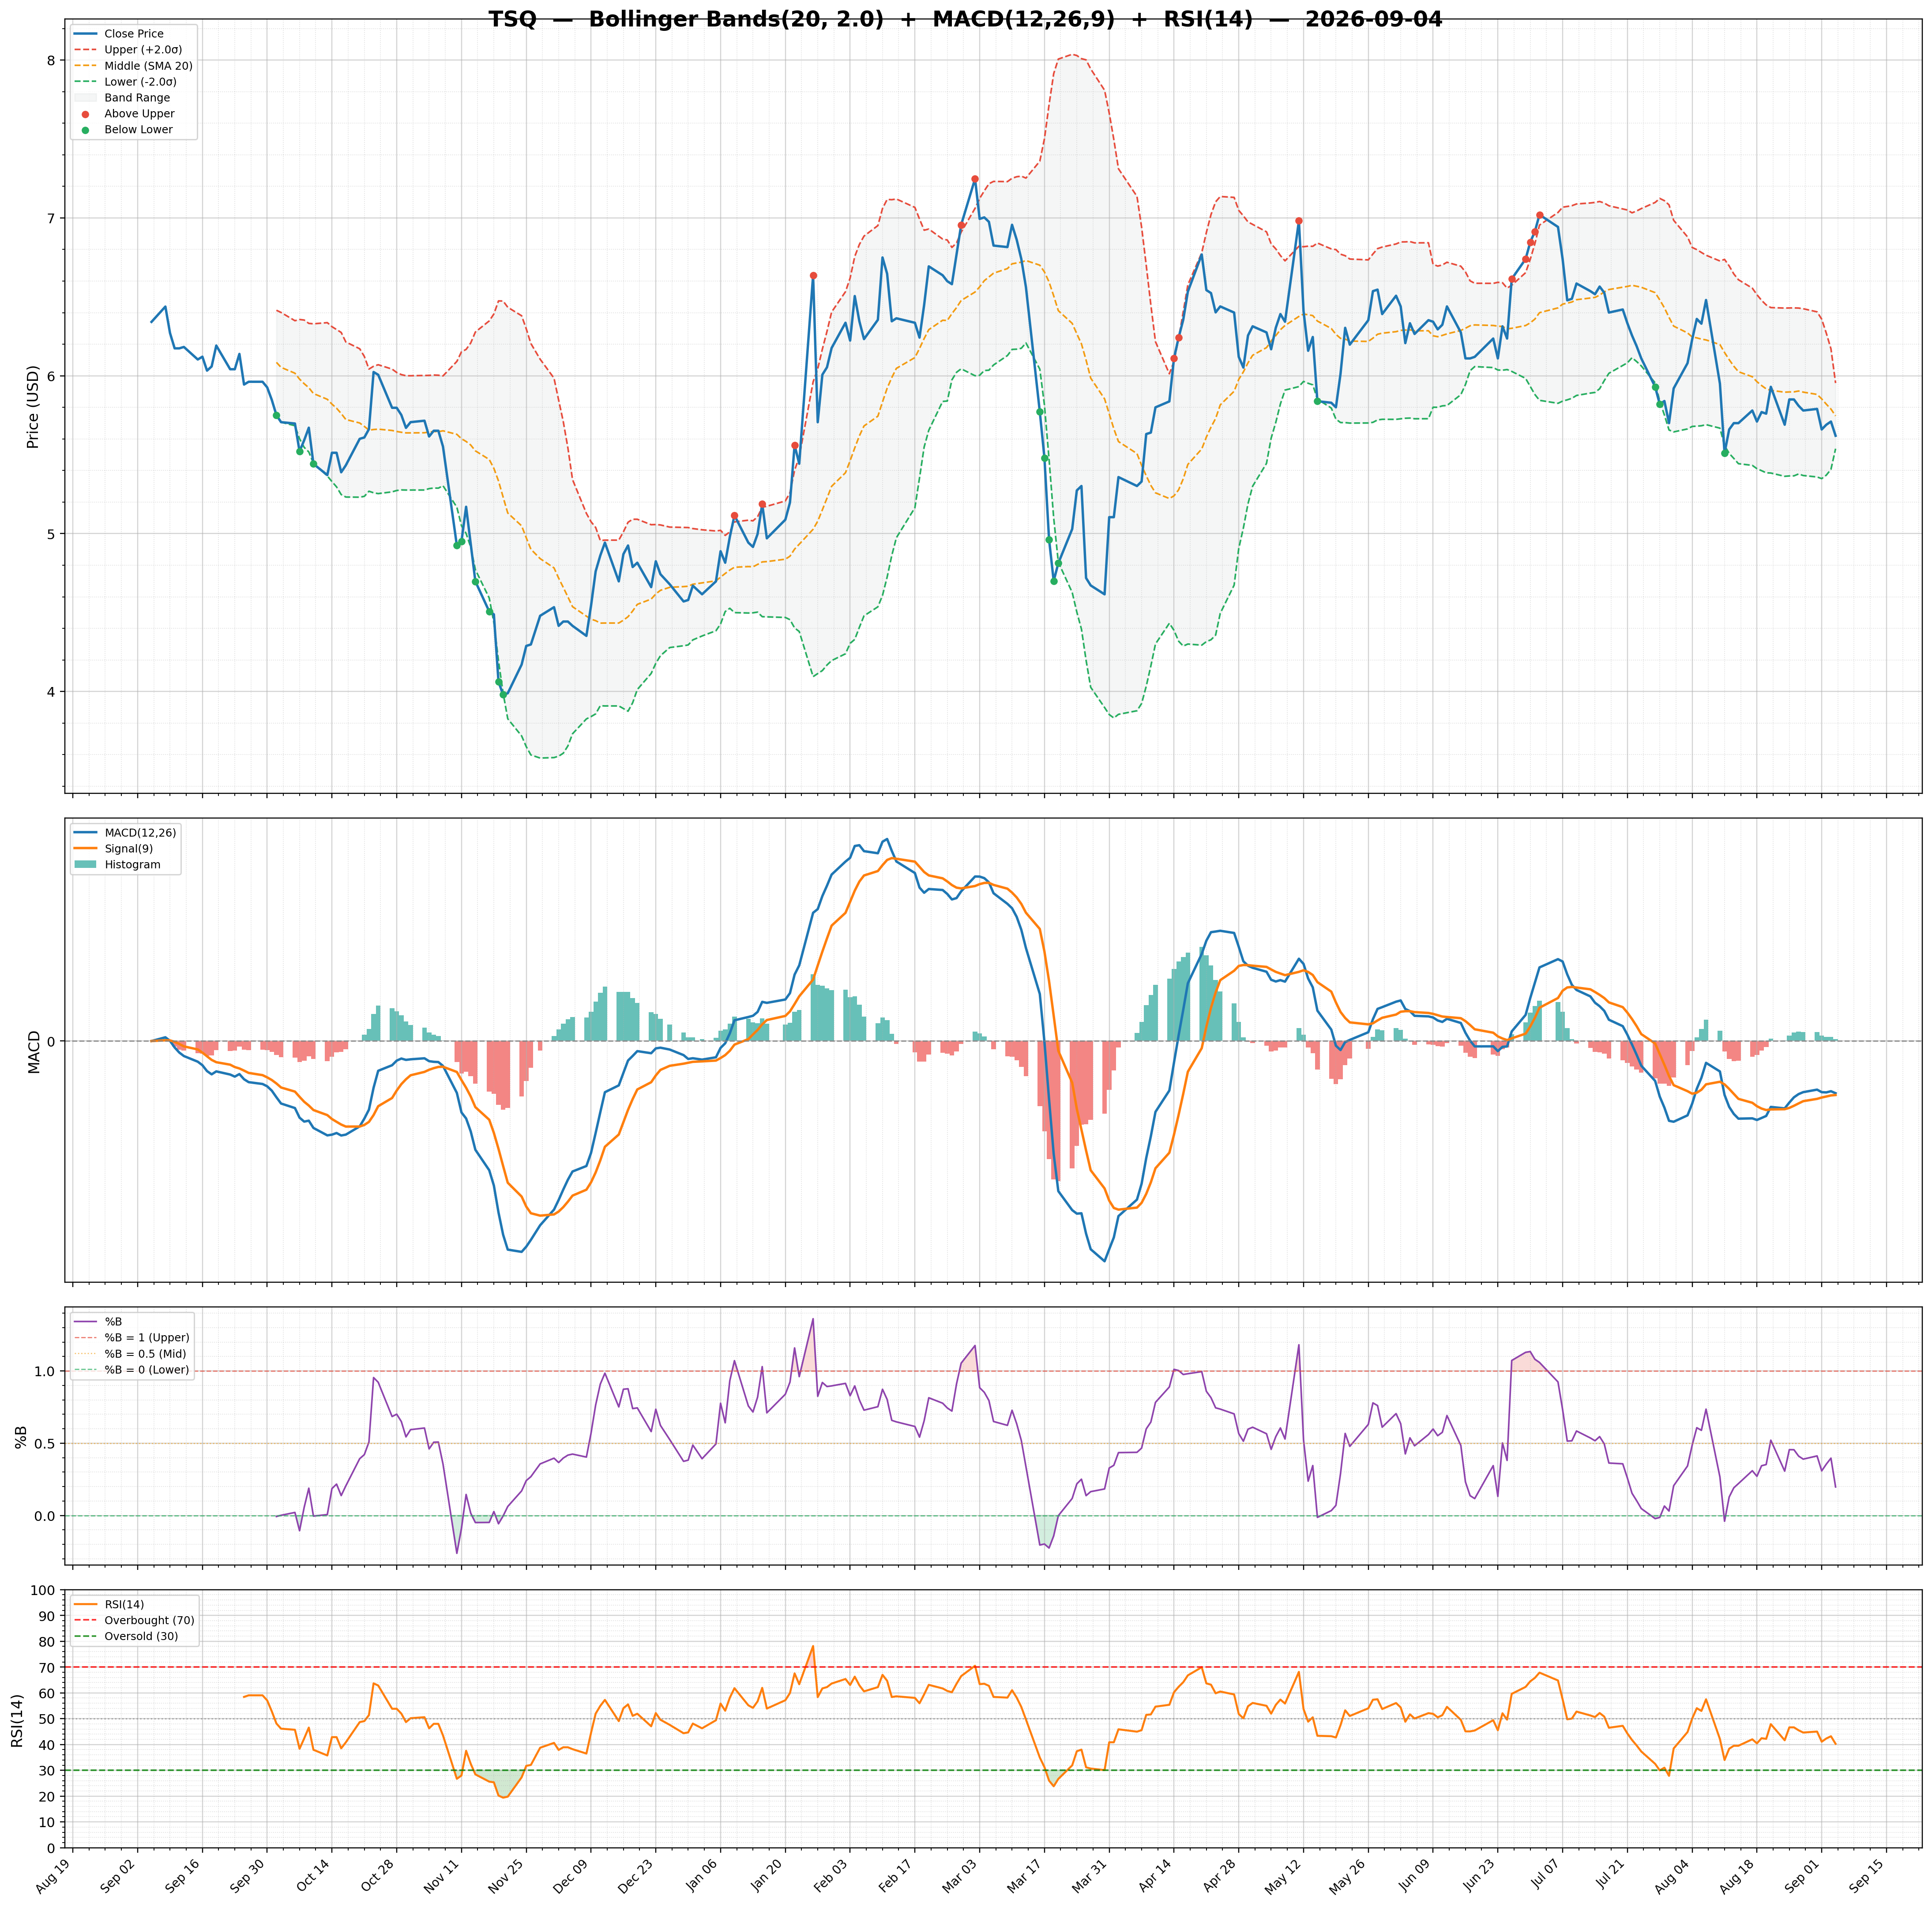
| RSI | 26.32 | Volume | 0.14M | Rating | strong_buy |
| Previous RSI | 26.32 | Avg Volume 20D | 0.11M | Target Mean | $10.00 |
| RSI Trend | Down | Relative Volume | 1.23 | Target High | $10.00 |
| MACD | -0.37 | Lower Band | 3.52 | Target Low | $10.00 |
| MACD Signal | -0.35 | Middle Band | 4.27 | Target Median | $10.00 |
| Histogram | -0.02 | Upper Band | 5.02 | Analysts | 2 |
| Previous Histogram | -0.03 | Bandwidth | 35.020 | Upside | 161.10% |
| Histogram Trend | Increasing | %B | 0.20 | ||