Tetra Technologies, Inc. (TTI)
Energy • Oil & Gas Equipment & Services • $5.15 • MCap: 787,747,264
https://onetetra.com • TETRA Technologies, Inc., together with its subsidiaries, operates as an energy services and solutions company. It operates through two segments, Completion Fluids & Products; and Water & Flowback Services. The Completion Fluids & Products segment manufactures and markets clear brine fluids, additives, and associated products and services to the oil and gas industry for use in well drilling, completion, and workover operations in the United States, as well as in Latin America, Europe, Asia, the Middle East, and Africa. This segment also markets liquid and dry calcium chloride products; and TETRA PureFlow ultra-pure zinc bromide to battery technology companies. Its Water & Flowback Services segment provides water management services for onshore oil and gas operators. This segment also offers frac flowback, early production facilities and services, production well testing, and other associated services in oil and gas producing regions in the United States, as well as in various basins in Latin America, Europe, and the Middle East. The company was incorporated in 1981 and is headquartered in Spring, Texas.
Reversal Strategy
Notes
10/23/2026
Hold to secalutive buy
| Score | Price | 52 Week & Averages | Relative Strength | Risk | |||||
|---|---|---|---|---|---|---|---|---|---|
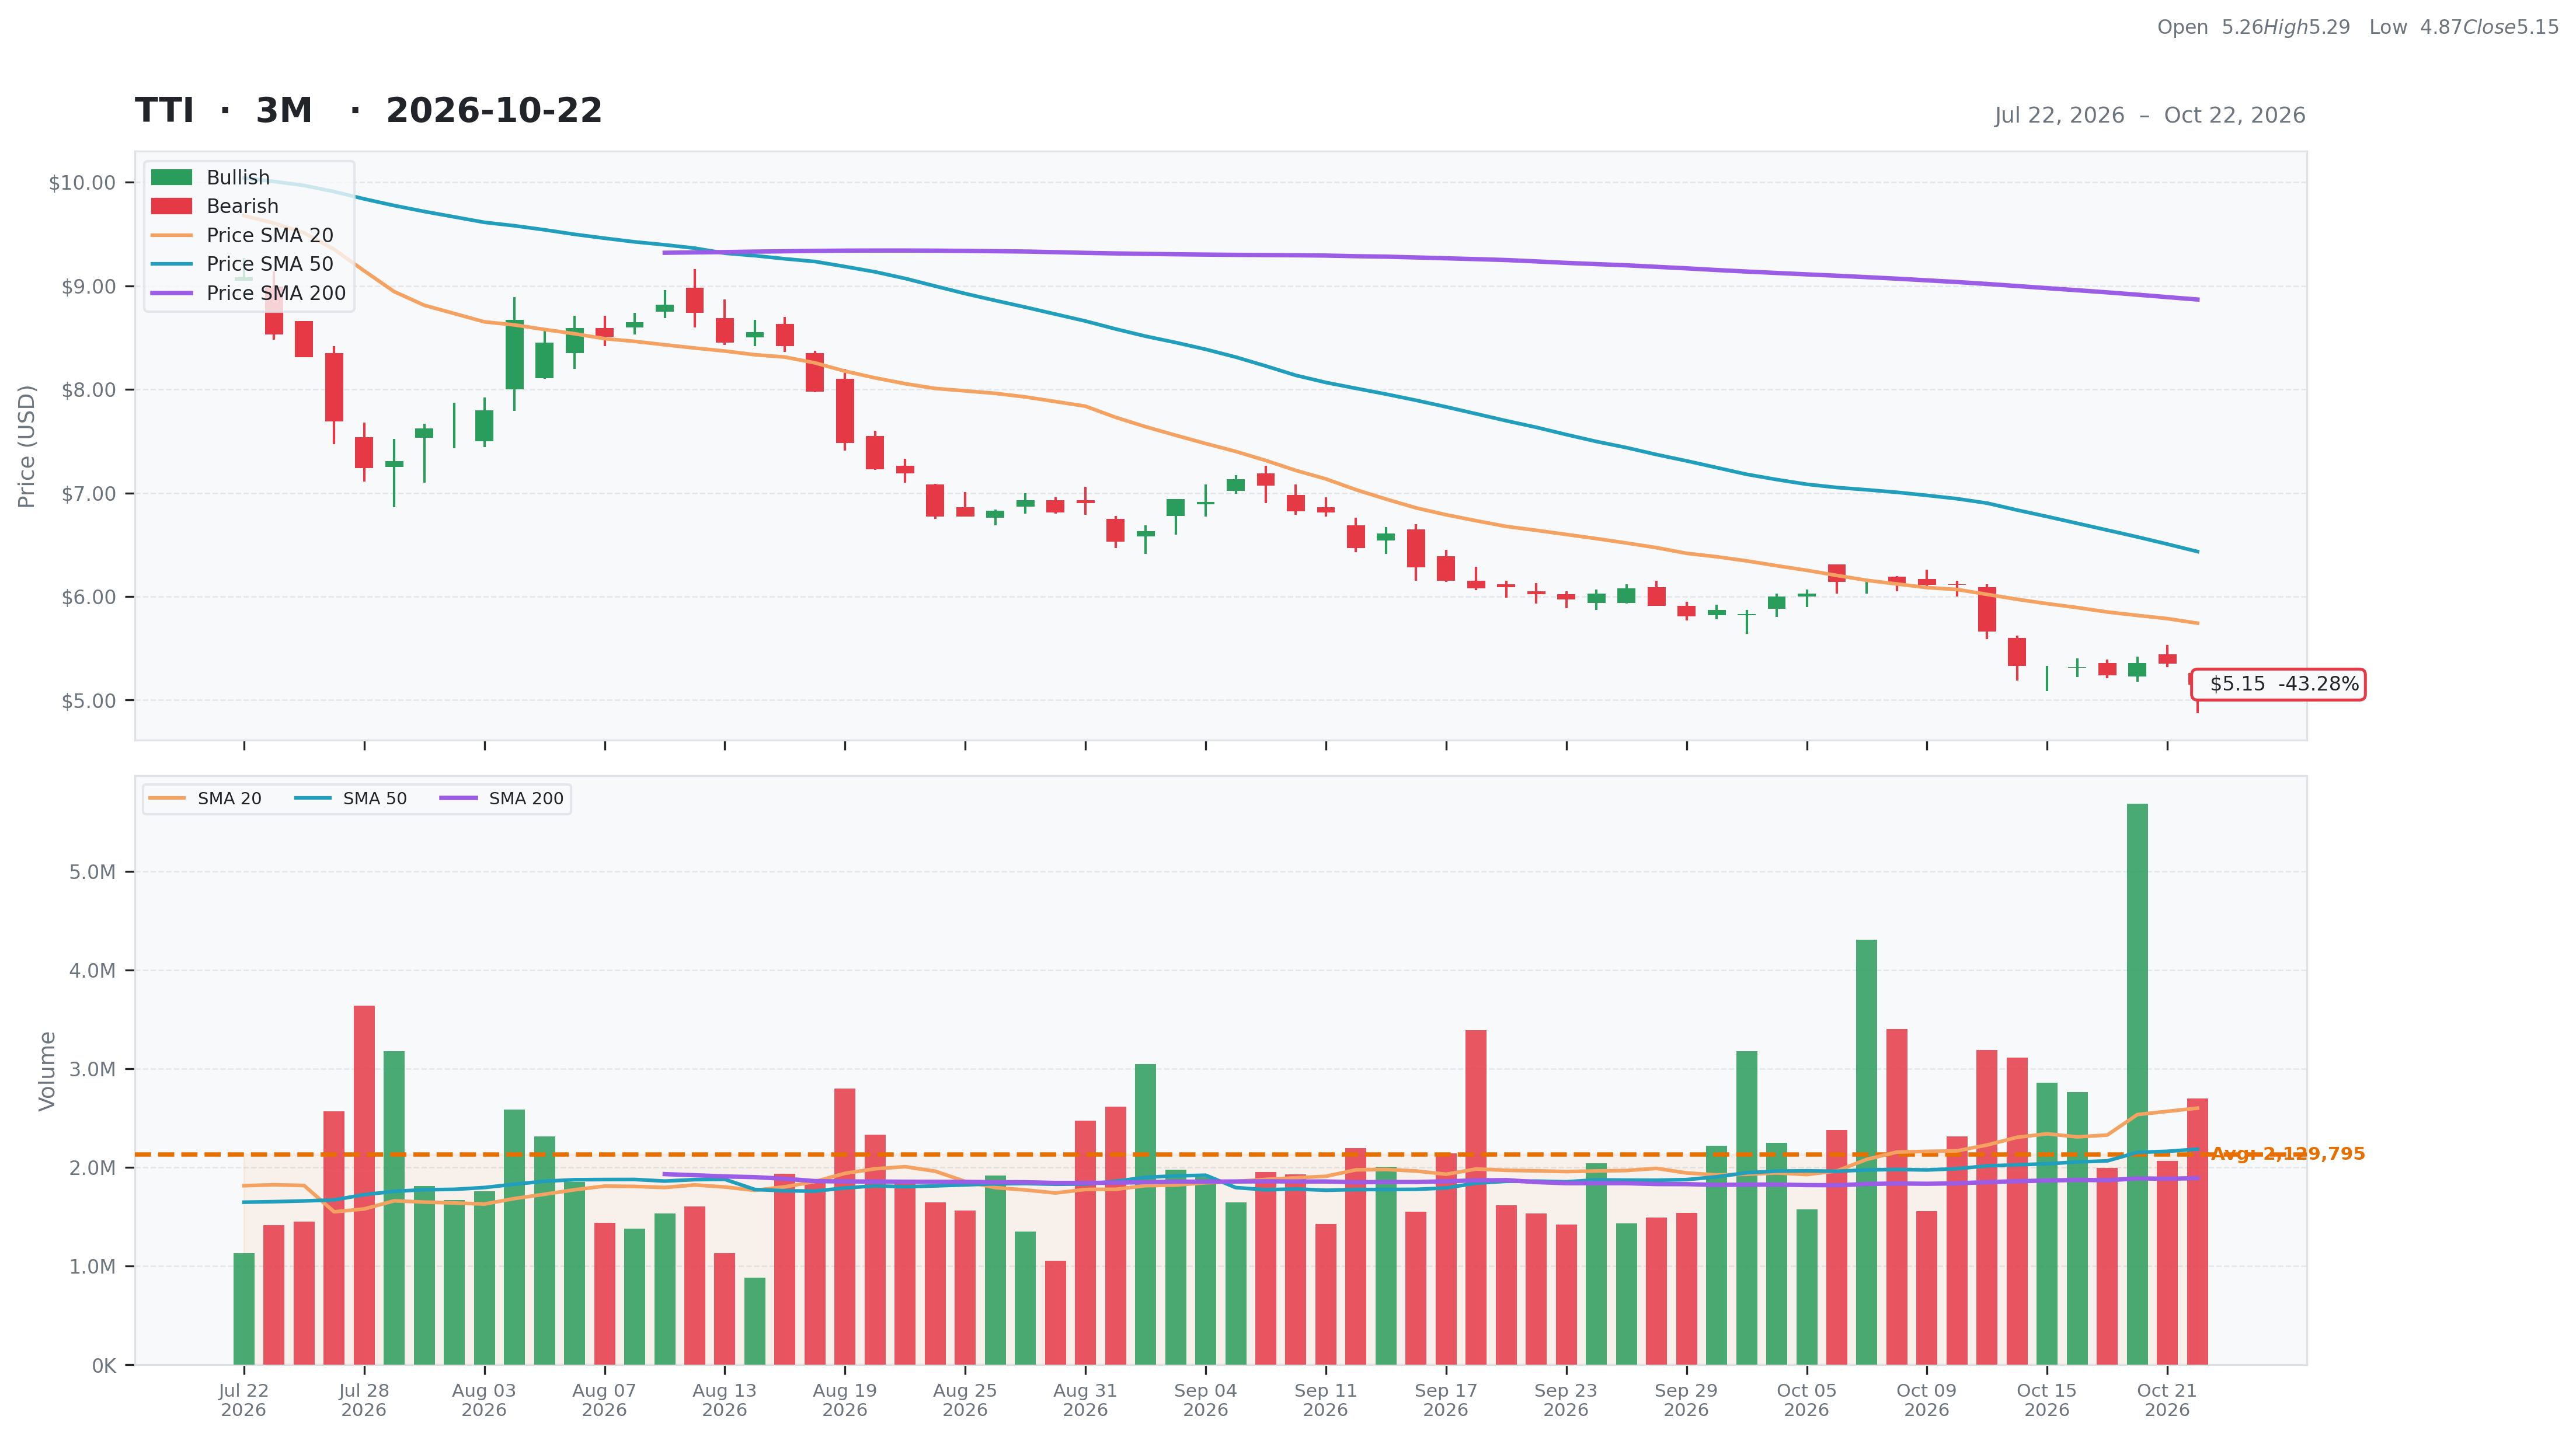
| Total | 44 | Current | $5.15 | 52W High | $12.32 -58.20% | Relative Strength | -0.43 | Beta | 1.26 |
| Business Quality | 9 | Weekly | $5.31 -3.01% | 52W Low | $5.15 0.00% | 3M | -0.38 | Short % | 0.08 |
| Financial Strength | 12 | Monthly | $6.02 -14.45% | Above 50DMA | $6.43 -19.96% | 6M | -0.46 | Risk Score | 3 |
| Growth Outlook | 4 | Quarterly | $8.31 -38.03% | Above 200DMA | $8.87 -41.92% | 9M | -0.57 | ||
| Momentum | 2 | Yearly | $7.64 -32.59% | 12M | -0.34 | ||||
| Valuation | Financial Strength | Growth/Profitability | |||
|---|---|---|---|---|---|
| Trailing P/E | 106.40 | Cash | 155M | Revenue Growth | 0.07% |
| Forward P/E | 18.34 | Debt | 224M | Earnings Growth | -0.12% |
| PEG Ratio | 1.82 | Debt/Equity | 55.06 | Qtr Earnings Growth | -0.09% |
| Price/Sales | 1.23 | Current Ratio | 2.46 | Gross Margin | 0.30% |
| Price/Book | 1.93 | Quick Ratio | 1.61 | Operating Margin | 0.11% |
| EV/Revenue | 1.33 | Operating CF | 71M | Profit Margin | 0.01% |
| EV/EBITDA | 9.76 | Free CF | 1M | EBITDA Margin | 0.14% |
| Ent Value | 856M | Return on Assets | 0.04% | ||
| Return on Equity | 0.02% | ||||
| Technical | Volume & Bollinger Bands | Analyst | |||
|---|---|---|---|---|---|
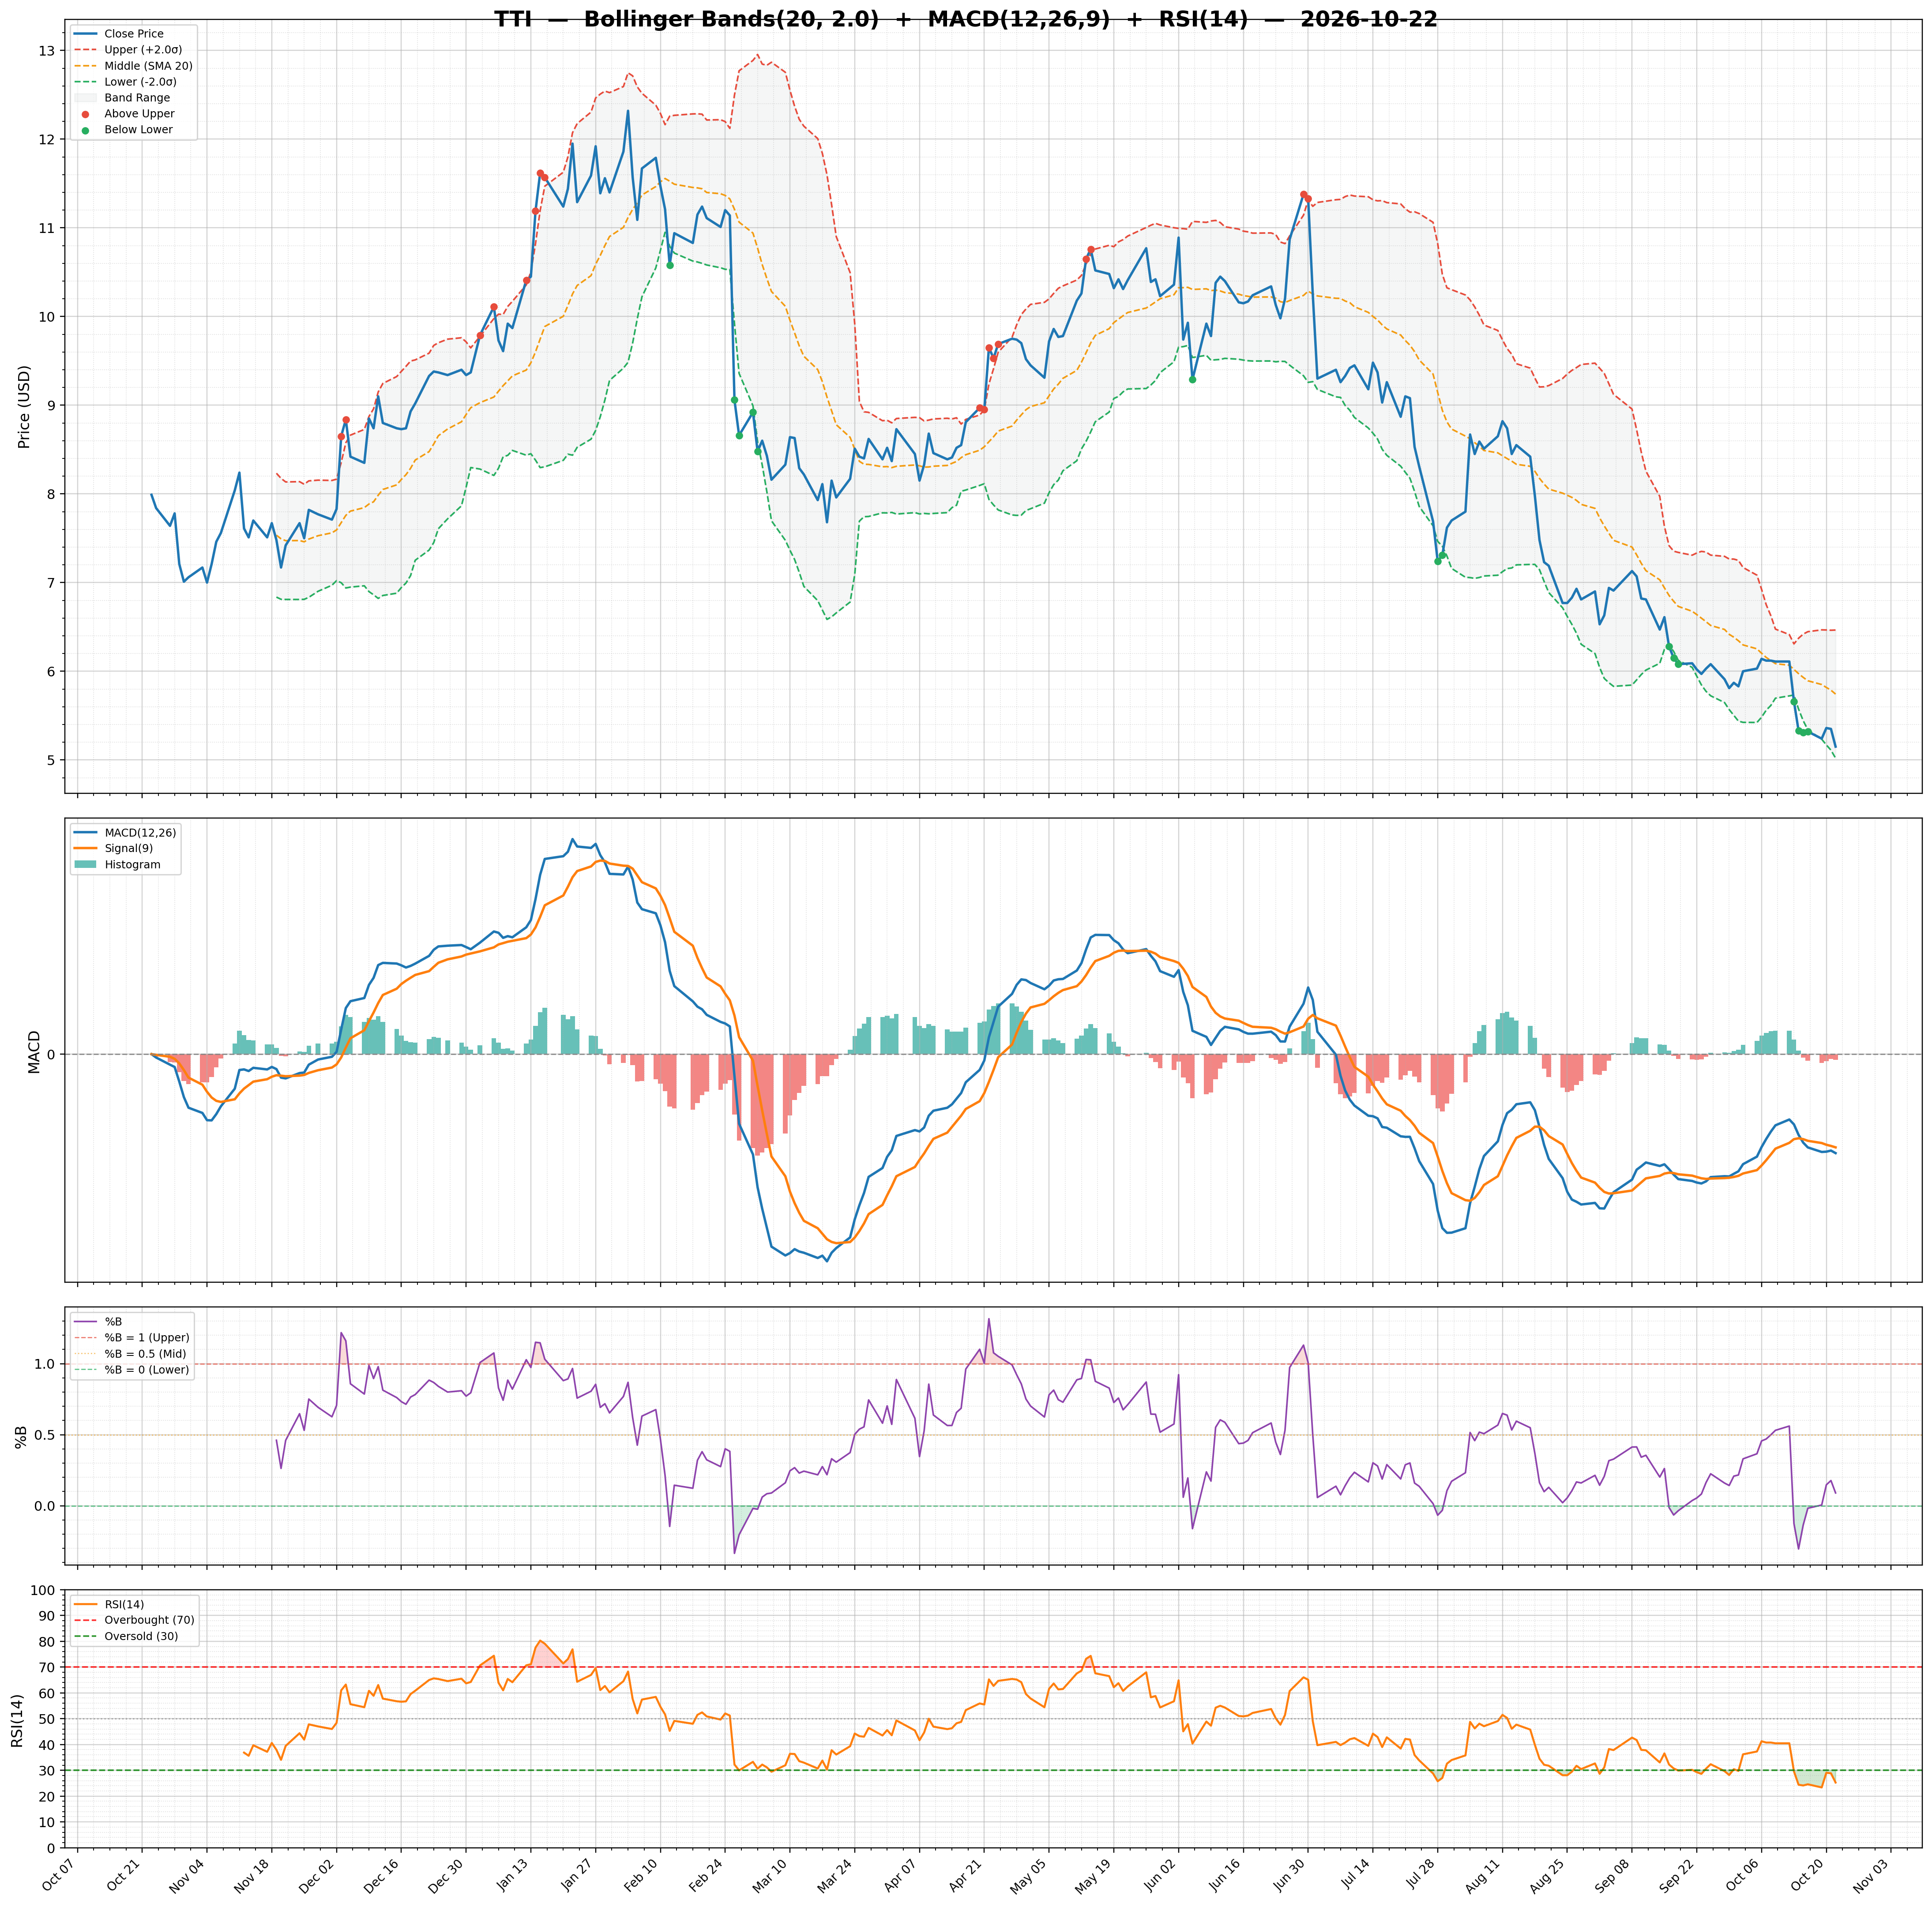
| RSI | 25.26 | Volume | 2.76M | Rating | strong_buy |
| Previous RSI | 28.85 | Avg Volume 20D | 2.6M | Target Mean | $11.12 |
| RSI Trend | Down | Relative Volume | 1.13 | Target High | $12.00 |
| MACD | -0.35 | Lower Band | 5.02 | Target Low | $10.00 |
| MACD Signal | -0.33 | Middle Band | 5.74 | Target Median | $11.25 |
| Histogram | -0.02 | Upper Band | 6.46 | Analysts | 4 |
| Previous Histogram | -0.02 | Bandwidth | 25.160 | Upside | 109.12% |
| Histogram Trend | Decreasing | %B | 0.09 | ||