Ultra Clean Holdings, Inc. (UCTT)
Technology • Semiconductor Equipment & Materials • $44.46 • MCap: 2,309,128,448
https://www.uct.com • Ultra Clean Holdings, Inc. develops and supplies critical subsystems, components and parts, and cleaning and analytical services for the semiconductor industry in the United States and internationally. The company offers outsourced solutions for the development, design, component sourcing and cleaning, prototyping, engineering, and manufacturing and testing of advanced systems. It also provides a range of gas delivery solutions, such as precision thermal products, valves, connectors, industrial process connectors and valves, pneumatic actuators, manifolds and safety solutions, hoses, pressure gauges, gas lines, and component heaters, as well as complex weldments. In addition, the company offers assemblies, including gas and fluid delivery solutions, wafer transport systems, mechatronic assemblies, process modules, and sub-fab process equipment support racks; weldments and frames with exacting standards; heaters, sensors, and controllers for precise temperature control; integrated device manufacturers and OEMs validated process tool chamber parts cleaning and coating services; and tool part process optimization solutions, analytical verification of process tool chamber part cleaning effectiveness and micro contamination analysis of tool parts, wafers and depositions, chemicals, cleanroom materials, deionized water, and airborne molecular contamination. It primarily serves customers in the semiconductor capital equipment and semiconductor integrated device manufacturing industries, as well as display, consumer, medical, energy, industrial, and research equipment industries. The company was founded in 1991 and is headquartered in Hayward, California.
Ex-AAII
| Score | Price | 52 Week & Averages | Relative Strength | Risk | |||||
|---|---|---|---|---|---|---|---|---|---|
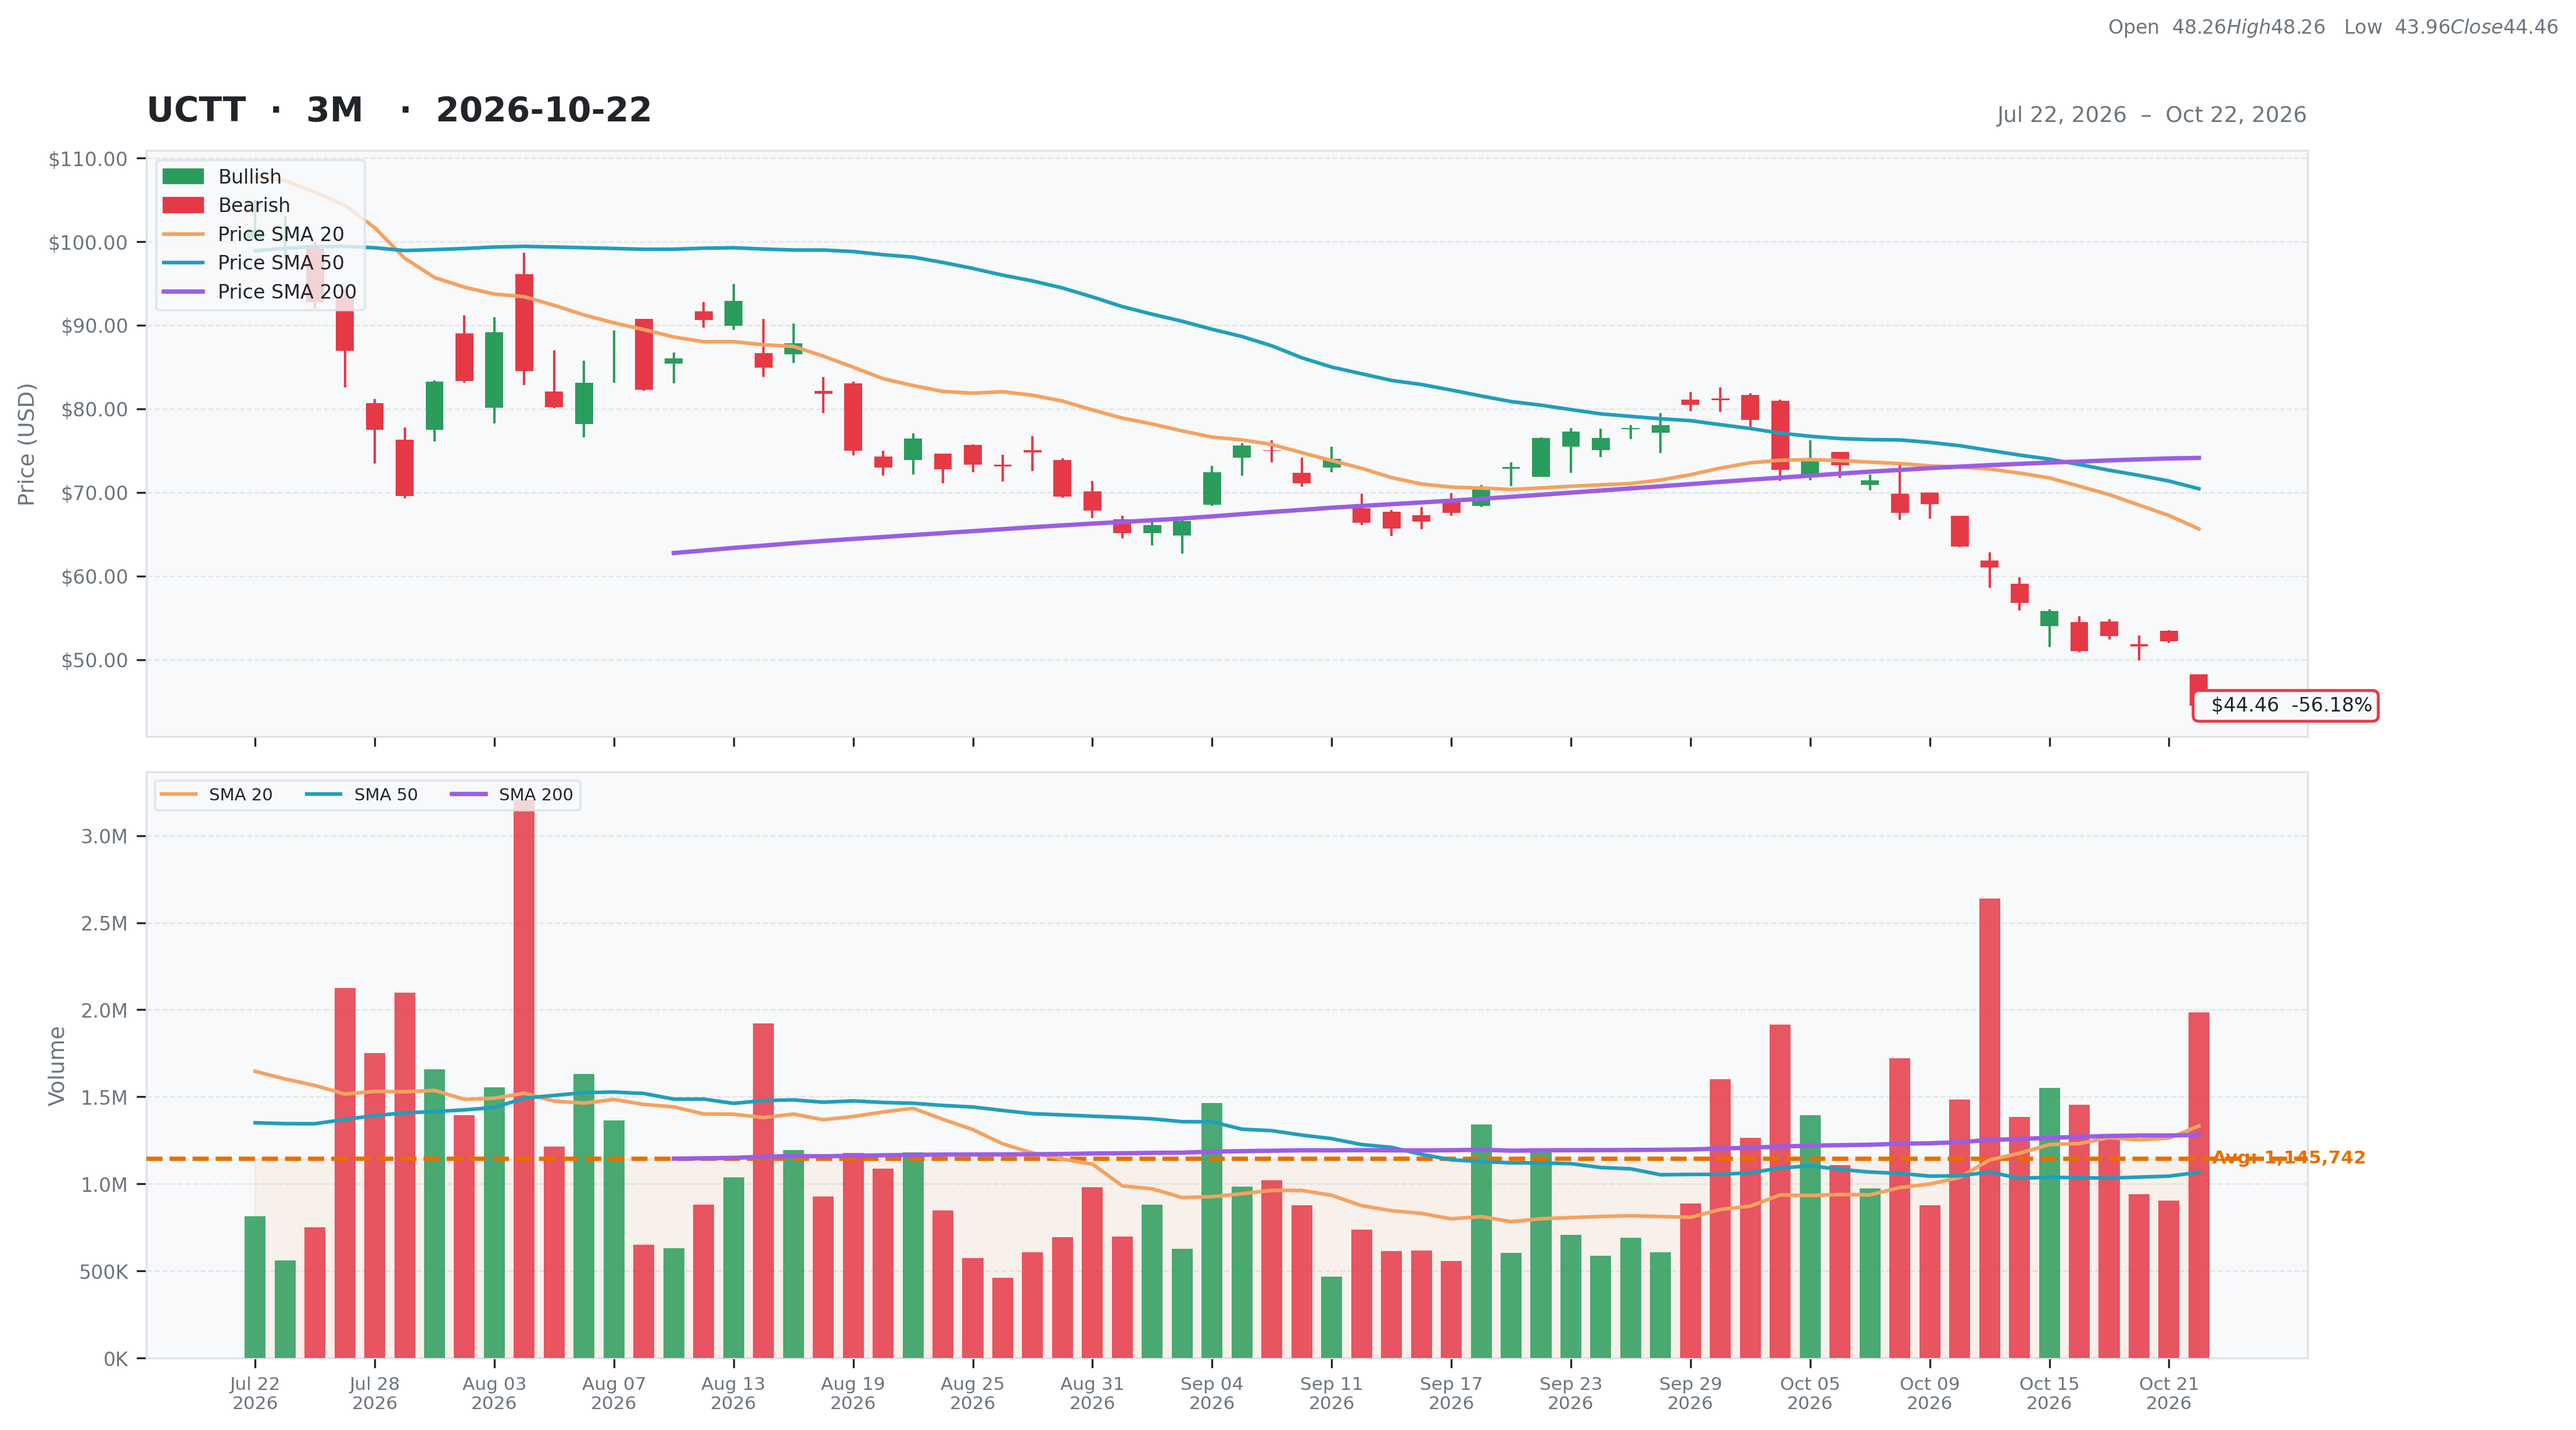
| Total | 35 | Current | $44.46 | 52W High | $142.59 -68.82% | Relative Strength | -0.20 | Beta | 1.86 |
| Business Quality | 1 | Weekly | $55.83 -20.37% | 52W Low | $21.65 105.36% | 3M | -0.52 | Short % | 0.11 |
| Financial Strength | 11 | Monthly | $76.55 -41.92% | Above 50DMA | $70.44 -36.88% | 6M | -0.43 | Risk Score | 1 |
| Growth Outlook | 1 | Quarterly | $92.75 -52.06% | Above 200DMA | $74.13 -40.03% | 9M | 0.01 | ||
| Momentum | 3 | Yearly | $30.41 46.20% | 12M | 0.48 | ||||
| Valuation | Financial Strength | Growth/Profitability | |||
|---|---|---|---|---|---|
| Trailing P/E | N/A | Cash | 256M | Revenue Growth | 0.24% |
| Forward P/E | 8.17 | Debt | 776M | Earnings Growth | N/A |
| PEG Ratio | 0.25 | Debt/Equity | 108.20 | Qtr Earnings Growth | N/A |
| Price/Sales | 1.05 | Current Ratio | 2.73 | Gross Margin | 0.16% |
| Price/Book | 3.61 | Quick Ratio | 1.09 | Operating Margin | 0.05% |
| EV/Revenue | 1.32 | Operating CF | -66M | Profit Margin | -0.01% |
| EV/EBITDA | 20.90 | Free CF | -81M | EBITDA Margin | 0.06% |
| Ent Value | 2,906M | Return on Assets | 0.02% | ||
| Return on Equity | -0.02% | ||||
| Technical | Volume & Bollinger Bands | Analyst | |||
|---|---|---|---|---|---|
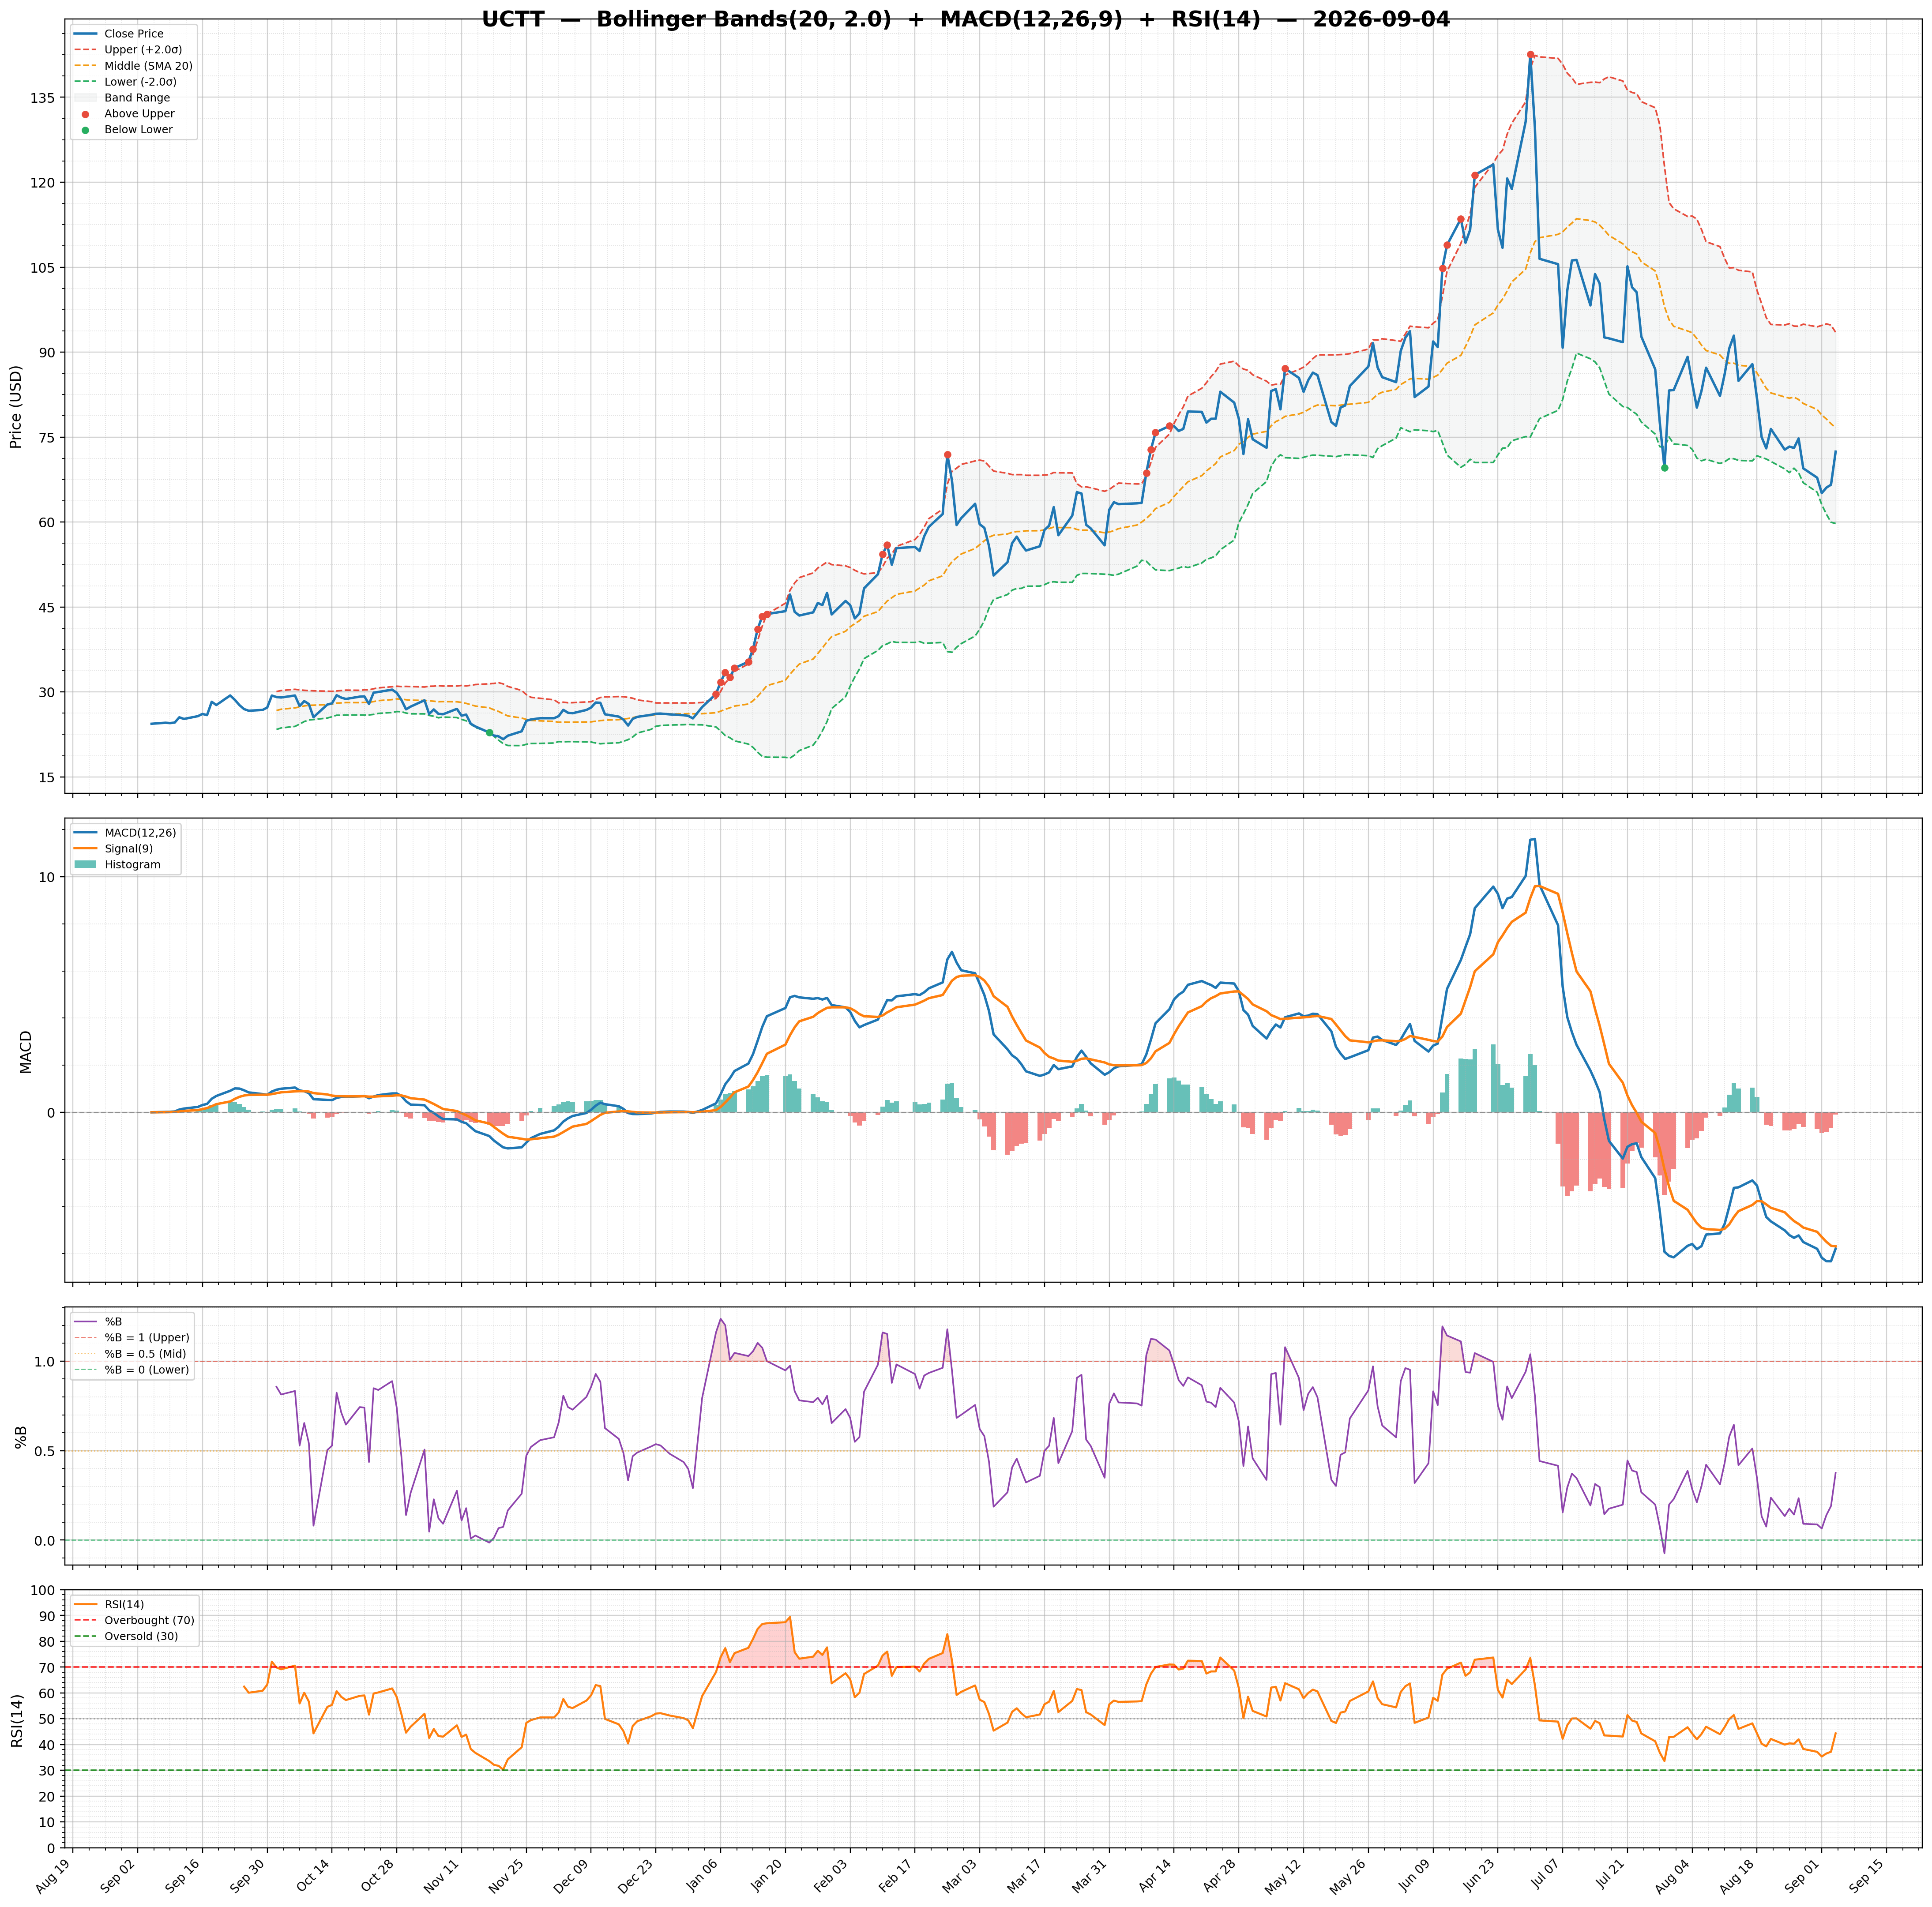
| RSI | 23.04 | Volume | 1.37M | Rating | strong_buy |
| Previous RSI | 28.73 | Avg Volume 20D | 1.33M | Target Mean | $132.83 |
| RSI Trend | Down | Relative Volume | 1.75 | Target High | $150.00 |
| MACD | -6.86 | Lower Band | 42.44 | Target Low | $120.00 |
| MACD Signal | -4.79 | Middle Band | 65.63 | Target Median | $131.00 |
| Histogram | -2.06 | Upper Band | 88.83 | Analysts | 6 |
| Previous Histogram | -1.86 | Bandwidth | 70.690 | Upside | 160.46% |
| Histogram Trend | Decreasing | %B | 0.04 | ||