Universal Corporation (UVV)
Consumer Defensive • Tobacco • $39.67 • MCap: 1,012,652,672
https://www.universalcorp.com • Universal Corporation, a business-to-business agriproducts company, provides leaf tobacco and plant-based ingredients to food and beverage end markets worldwide. The company operates in two segments, Tobacco Operations and Ingredients Operations. The Tobacco Operations segment is involved in procuring, processing, packing of flue-cured, burley, dark air-cured, and oriental leaf tobacco for consumer product manufacturers, as well as provision of related services. This segment also offers specialty services, such as custom blending, chemical and physical testing of tobacco, service cutting, reconstituted leaf tobacco manufacturing, and just-in-time product delivery services; and liquid nicotine for tobacco products manufacturers, as well as recycled waste materials from tobacco production. The Ingredients Operations segment engages in the production of specialty plant-based ingredients, including fruits, vegetables, herbs, fruit and vegetable juices, concentrates, pomaces, ciders, purees, nutraceuticals, fruit fibers, seeds, seed powders, dehydrated products, botanical extracts, distillates, natural flavors, colors, and other value-added products for consumer-packaged goods manufacturers and retailers, as well as food, and beverage companies. The company was founded in 1918 and is headquartered in Richmond, Virginia.
Notes
10/05/2026
exit
| Score | Price | 52 Week & Averages | Relative Strength | Risk | |||||
|---|---|---|---|---|---|---|---|---|---|
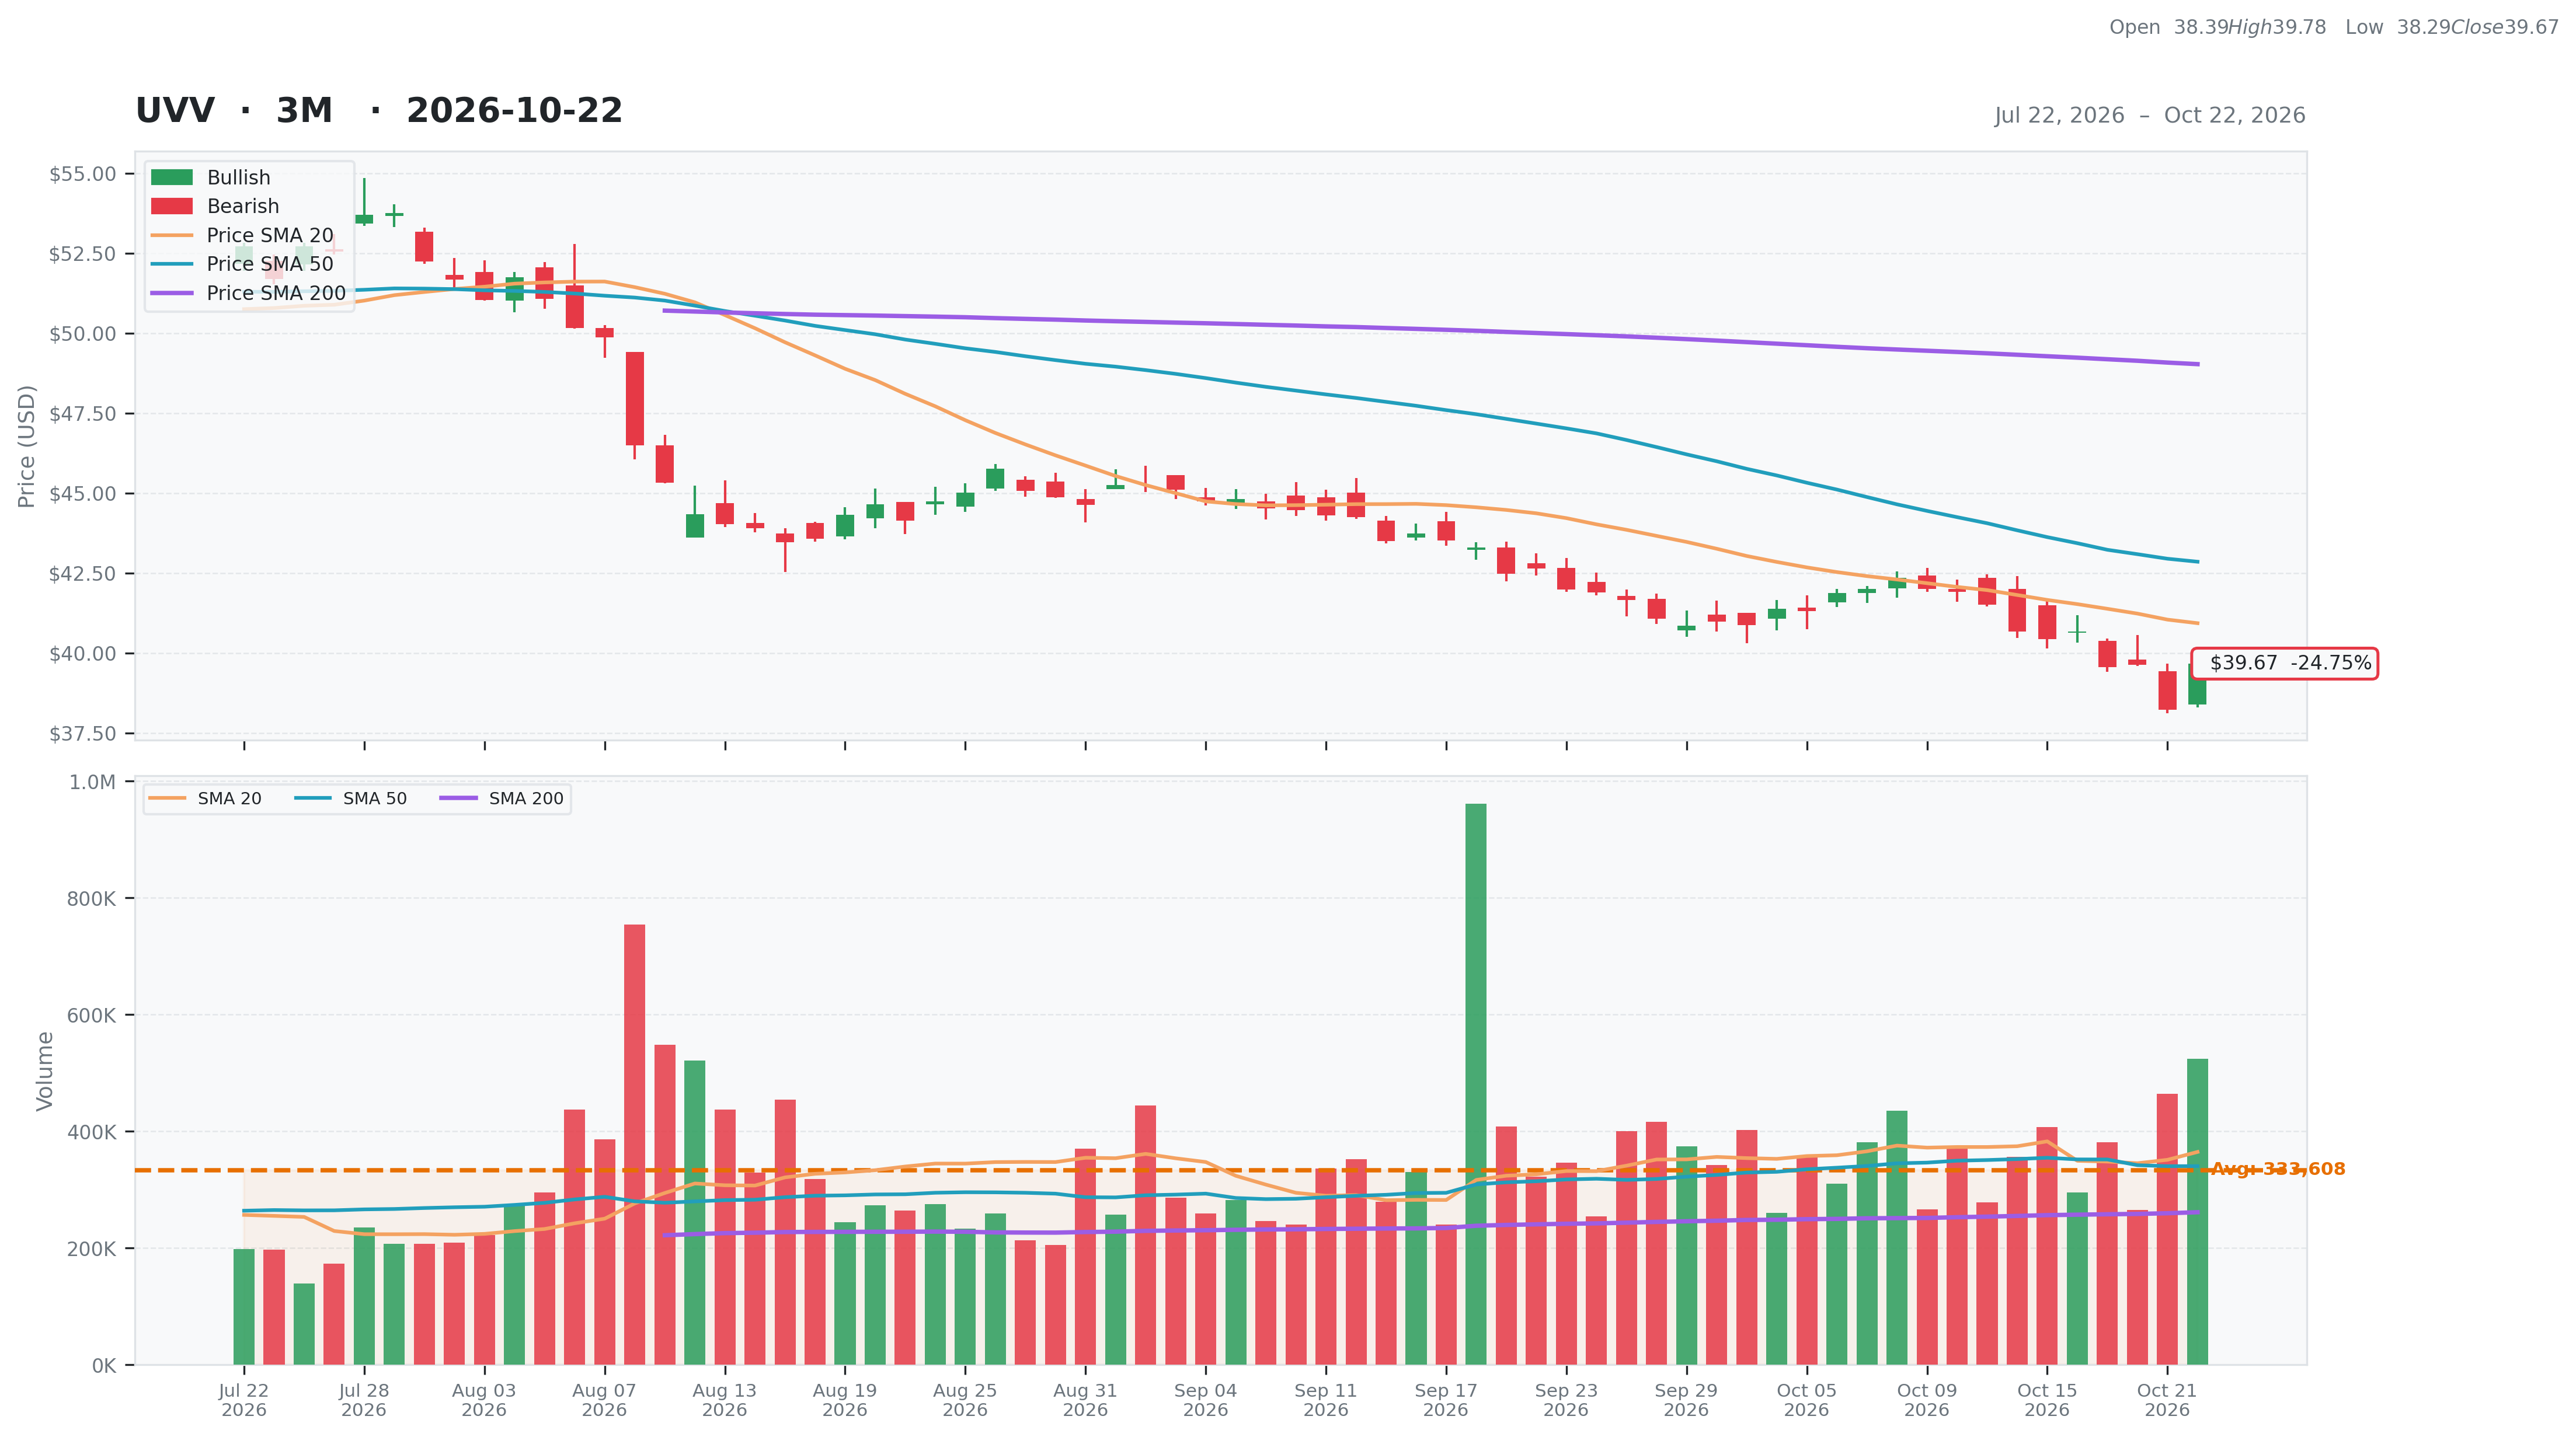
| Total | 32 | Current | $39.67 | 52W High | $55.83 -28.94% | Relative Strength | -0.23 | Beta | 0.57 |
| Business Quality | 1 | Weekly | $40.43 -1.88% | 52W Low | $38.22 3.79% | 3M | -0.25 | Short % | 0.11 |
| Financial Strength | 8 | Monthly | $42.64 -6.97% | Above 50DMA | $42.85 -7.43% | 6M | -0.24 | Risk Score | 6 |
| Growth Outlook | 5 | Quarterly | $52.72 -24.75% | Above 200DMA | $49.03 -19.09% | 9M | -0.23 | ||
| Momentum | 2 | Yearly | $48.73 -18.59% | 12M | -0.21 | ||||
| Valuation | Financial Strength | Growth/Profitability | |||
|---|---|---|---|---|---|
| Trailing P/E | 53.51 | Cash | 174M | Revenue Growth | -0.12% |
| Forward P/E | 10.30 | Debt | 1,217M | Earnings Growth | N/A |
| PEG Ratio | 11.14 | Debt/Equity | 85.54 | Qtr Earnings Growth | N/A |
| Price/Sales | 0.35 | Current Ratio | 2.57 | Gross Margin | 0.17% |
| Price/Book | 0.73 | Quick Ratio | 0.72 | Operating Margin | 0.00% |
| EV/Revenue | 0.73 | Operating CF | 217M | Profit Margin | 0.01% |
| EV/EBITDA | 9.04 | Free CF | 156M | EBITDA Margin | 0.08% |
| Ent Value | 2,090M | Return on Assets | 0.04% | ||
| Return on Equity | 0.02% | ||||
| Technical | Volume & Bollinger Bands | Analyst | |||
|---|---|---|---|---|---|
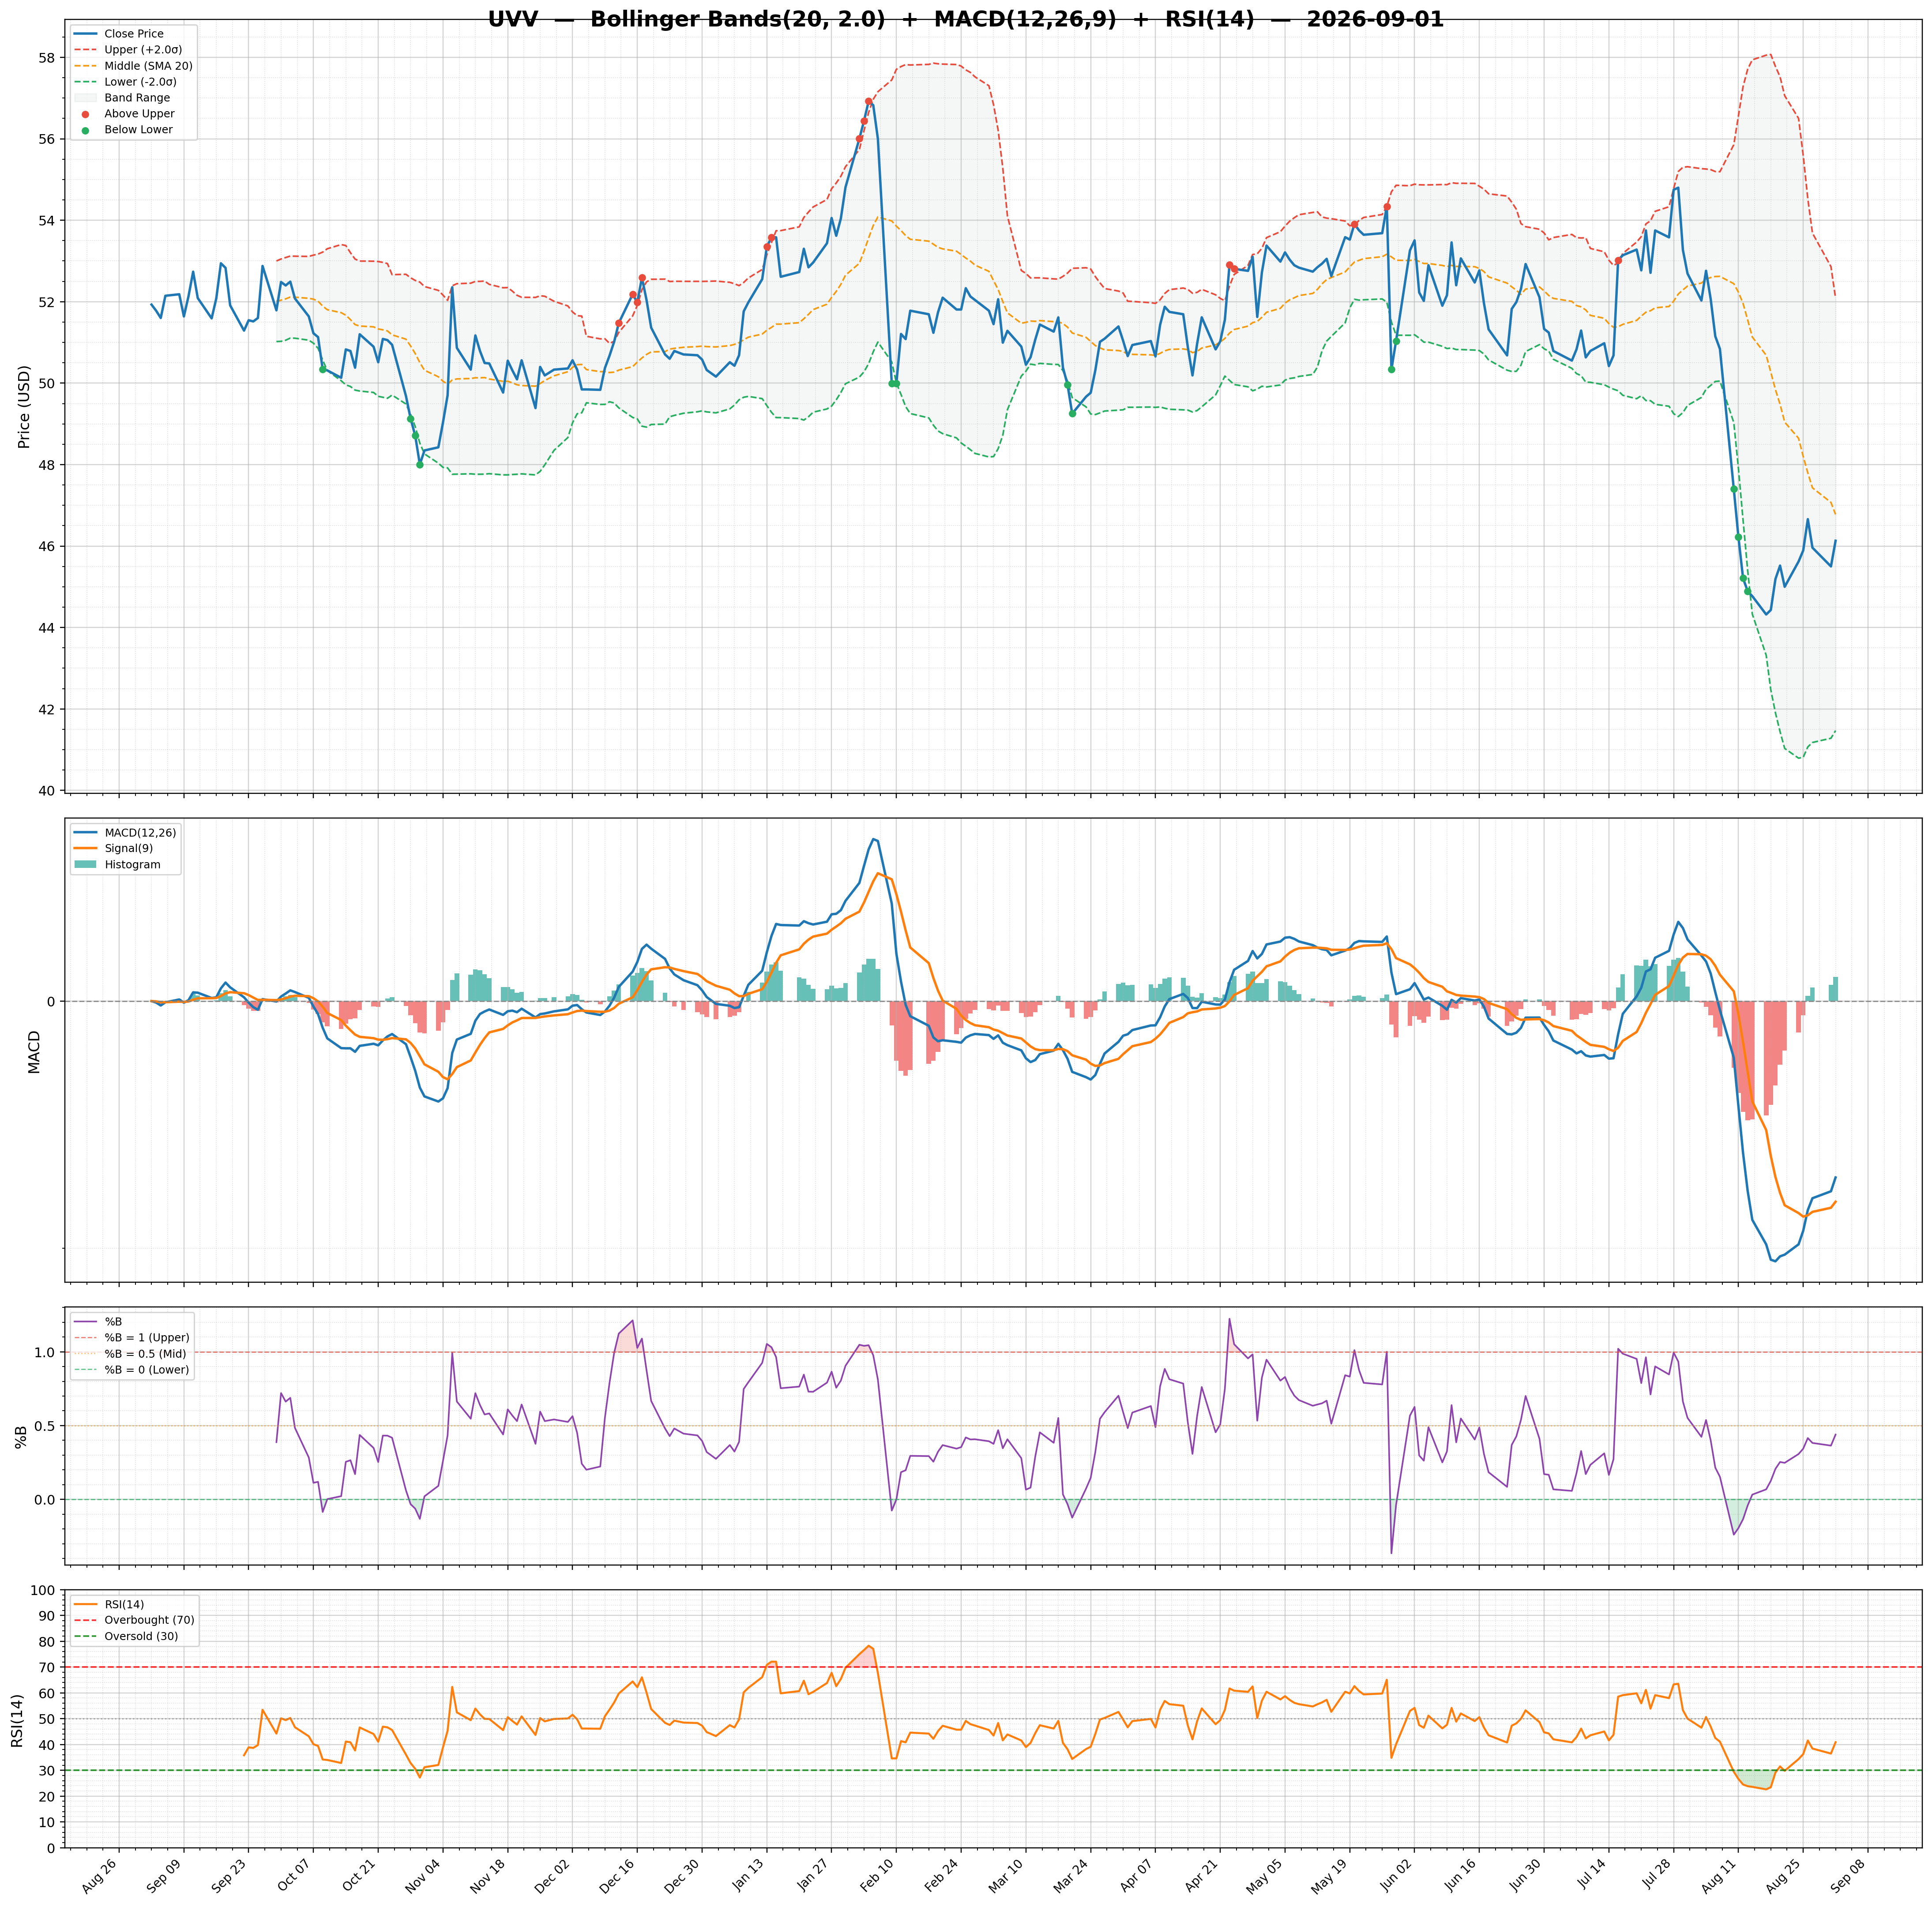
| RSI | 36.66 | Volume | 0.29M | Rating | none |
| Previous RSI | 21.09 | Avg Volume 20D | 0.36M | Target Mean | $67.00 |
| RSI Trend | Up | Relative Volume | 1.41 | Target High | $67.00 |
| MACD | -1.08 | Lower Band | 38.87 | Target Low | $67.00 |
| MACD Signal | -0.97 | Middle Band | 40.93 | Target Median | $67.00 |
| Histogram | -0.11 | Upper Band | 43.00 | Analysts | 1 |
| Previous Histogram | -0.16 | Bandwidth | 10.100 | Upside | 64.74% |
| Histogram Trend | Increasing | %B | 0.19 | ||