Vishay Precision Group, Inc. (VPG)
Technology • Scientific & Technical Instruments • $52.69 • MCap: 803,380,416
https://vpgsensors.com • Vishay Precision Group, Inc. engages in the precision measurement and sensing technologies business in the United States, Europe, Israel, Asia, and Canada. It operates through three segments: Sensors, Weighing Solutions, and Measurement Systems. The company offers precision resistors, strain gages, load cells and force measurement transducers, vehicle weighing and over-load monitoring systems, and control process weighing products; rolling force measuring load cell systems and pressure transmitters; web tension measurement load cells and systems; optical strip width gages; and laser velocimeters for speed and length measurements and closed-loop crop optimization control systems for optimal strip cuts. The company also offers thermal-mechanical simulation systems for metallurgical research; conditioning, data acquisition, and control systems; and data acquisition systems and sensors for product safety testing, as well as electronic displays, signal processors, micro-electromechanical system sensors, cabling, system software, and communications software/hardware. Its products are used in waste management, bulk hauling, logging, scales manufacturing, engineering systems, pharmaceutical, oil, chemical, steel, paper, and food industries, as well as test and measurement, steel, medical, construction, agricultural, and consumer markets. The company offers its products under the VFR, Alpha Electronics, Powertron, APR, Celtron, Revere, Sensortronics, Tedea-Huntleigh, Stress-tek, Vulcan, BLH Nobel, KELK, Gleeble, DTS, and Pacific Instruments brands. Vishay Precision Group, Inc. was incorporated in 2009 and is headquartered in Malvern, Pennsylvania.
AAII
| Score | Price | 52 Week & Averages | Relative Strength | Risk | |||||
|---|---|---|---|---|---|---|---|---|---|
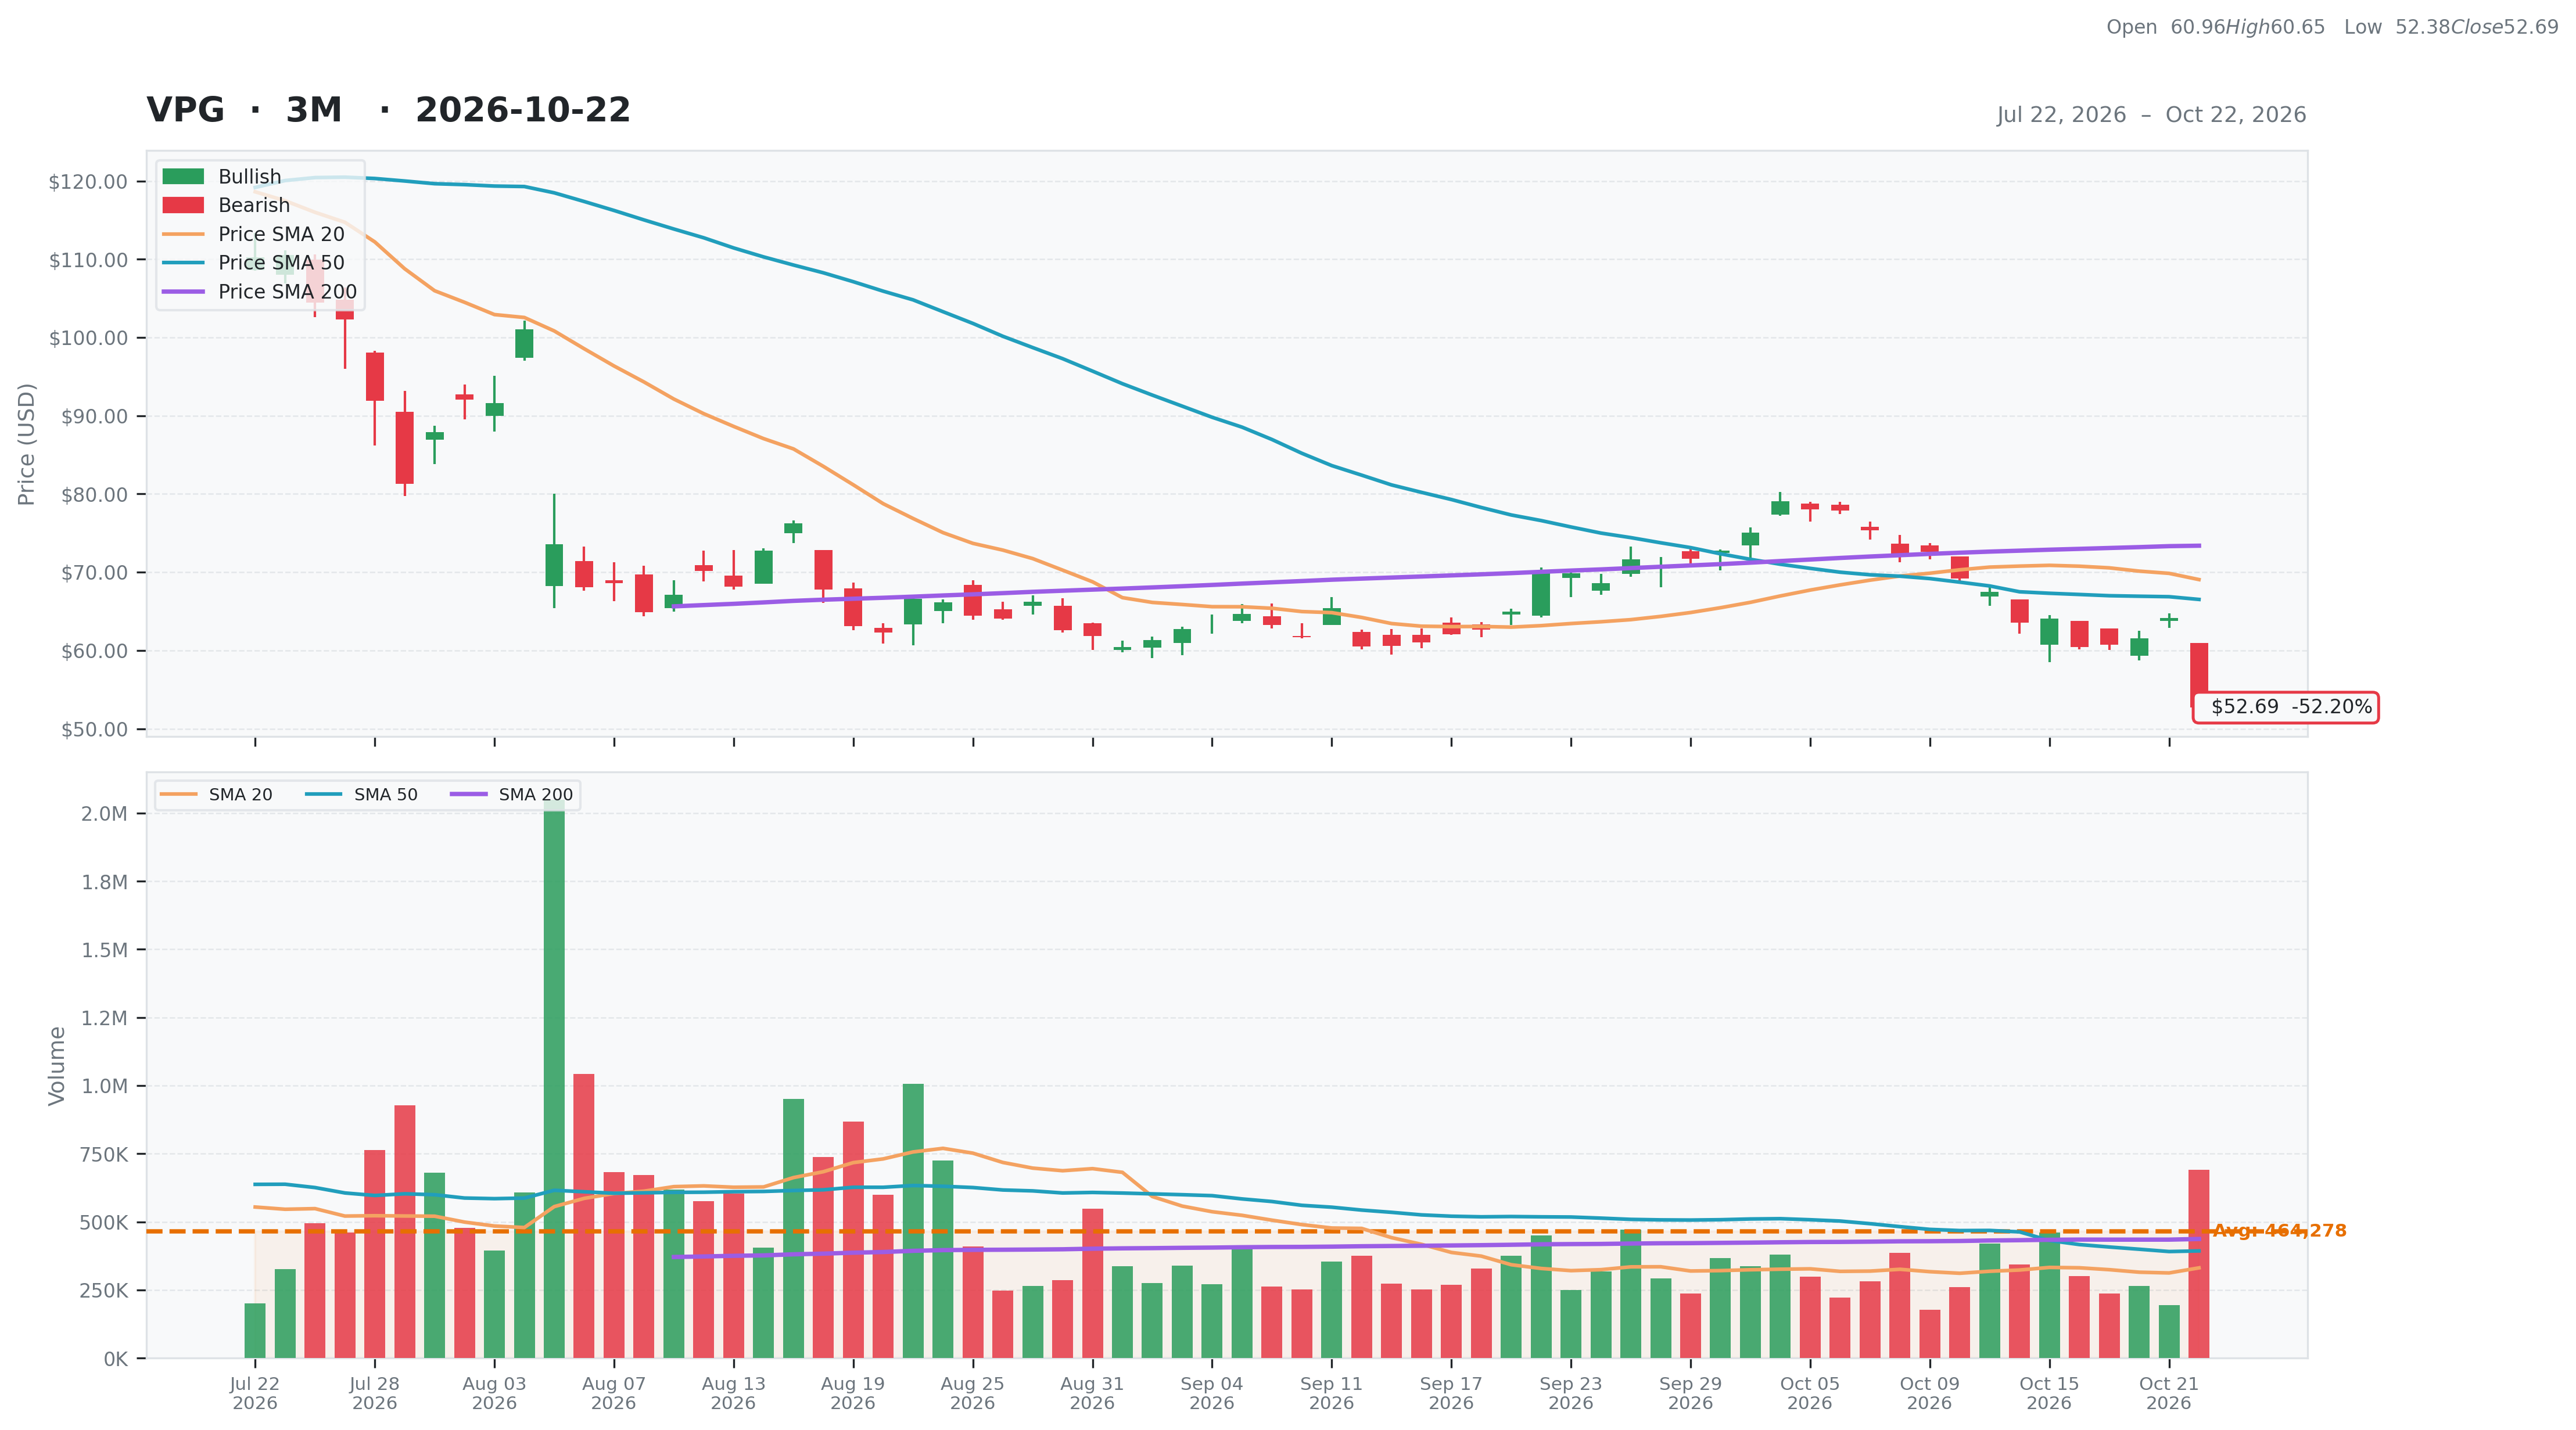
| Total | 43 | Current | $52.69 | 52W High | $149.91 -64.85% | Relative Strength | -0.11 | Beta | 1.39 |
| Business Quality | 7 | Weekly | $64.06 -17.75% | 52W Low | $29.28 79.95% | 3M | -0.50 | Short % | 0.14 |
| Financial Strength | 16 | Monthly | $69.91 -24.63% | Above 50DMA | $66.52 -20.79% | 6M | -0.09 | Risk Score | 6 |
| Growth Outlook | 5 | Quarterly | $104.44 -49.55% | Above 200DMA | $73.38 -28.20% | 9M | 0.10 | ||
| Momentum | 2 | Yearly | $35.96 46.52% | 12M | 0.44 | ||||
| Valuation | Financial Strength | Growth/Profitability | |||
|---|---|---|---|---|---|
| Trailing P/E | 201.33 | Cash | 76M | Revenue Growth | 0.12% |
| Forward P/E | 33.74 | Debt | 39M | Earnings Growth | N/A |
| PEG Ratio | 1.75 | Debt/Equity | 11.80 | Qtr Earnings Growth | N/A |
| Price/Sales | 2.44 | Current Ratio | 4.16 | Gross Margin | 0.39% |
| Price/Book | 2.42 | Quick Ratio | 2.35 | Operating Margin | 0.01% |
| EV/Revenue | 2.34 | Operating CF | 3M | Profit Margin | 0.01% |
| EV/EBITDA | 32.59 | Free CF | 6M | EBITDA Margin | 0.07% |
| Ent Value | 768M | Return on Assets | 0.01% | ||
| Return on Equity | 0.01% | ||||
| Technical | Volume & Bollinger Bands | Analyst | |||
|---|---|---|---|---|---|
| RSI | 29.71 | Volume | 0.3M | Rating | none |
| Previous RSI | 42.76 | Avg Volume 20D | 0.33M | Target Mean | $93.33 |
| RSI Trend | Down | Relative Volume | 2.10 | Target High | $105.00 |
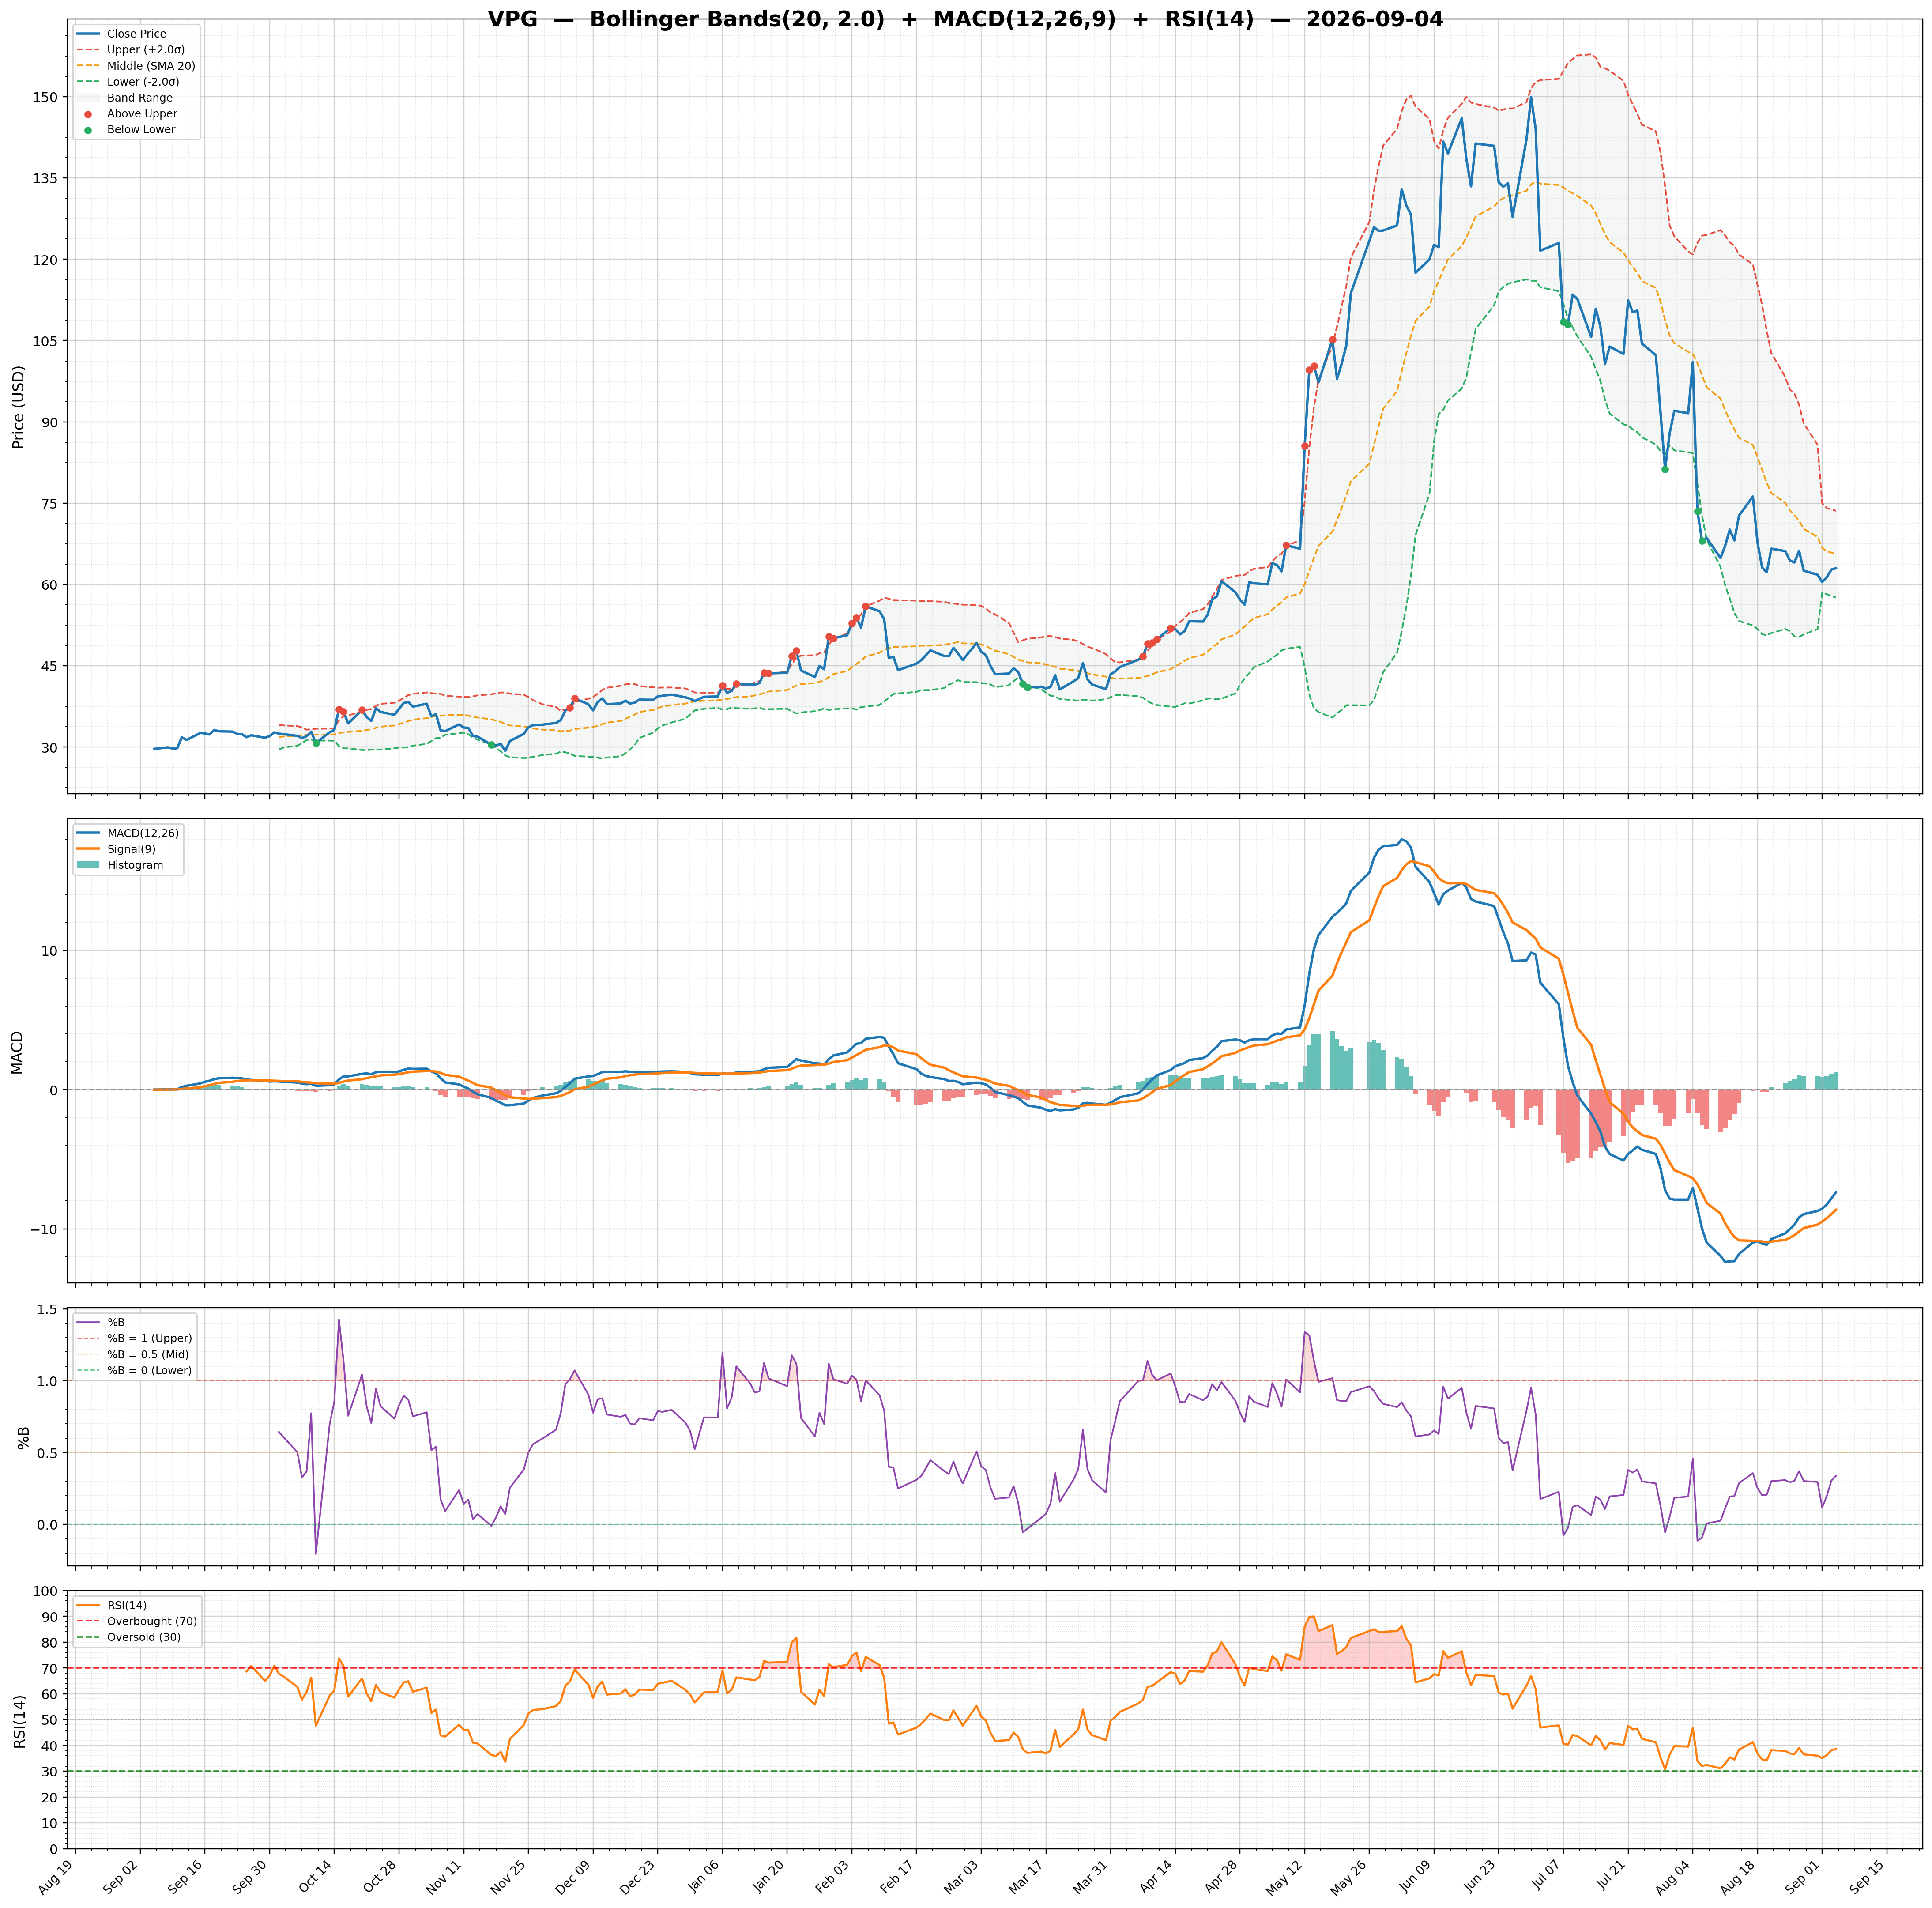
| MACD | -2.89 | Lower Band | 54.99 | Target Low | $77.00 |
| MACD Signal | -1.24 | Middle Band | 69.06 | Target Median | $98.00 |
| Histogram | -1.65 | Upper Band | 83.12 | Analysts | 3 |
| Previous Histogram | -1.16 | Bandwidth | 40.730 | Upside | 54.53% |
| Histogram Trend | Decreasing | %B | -0.08 | ||