VSE Corporation (VSEC)
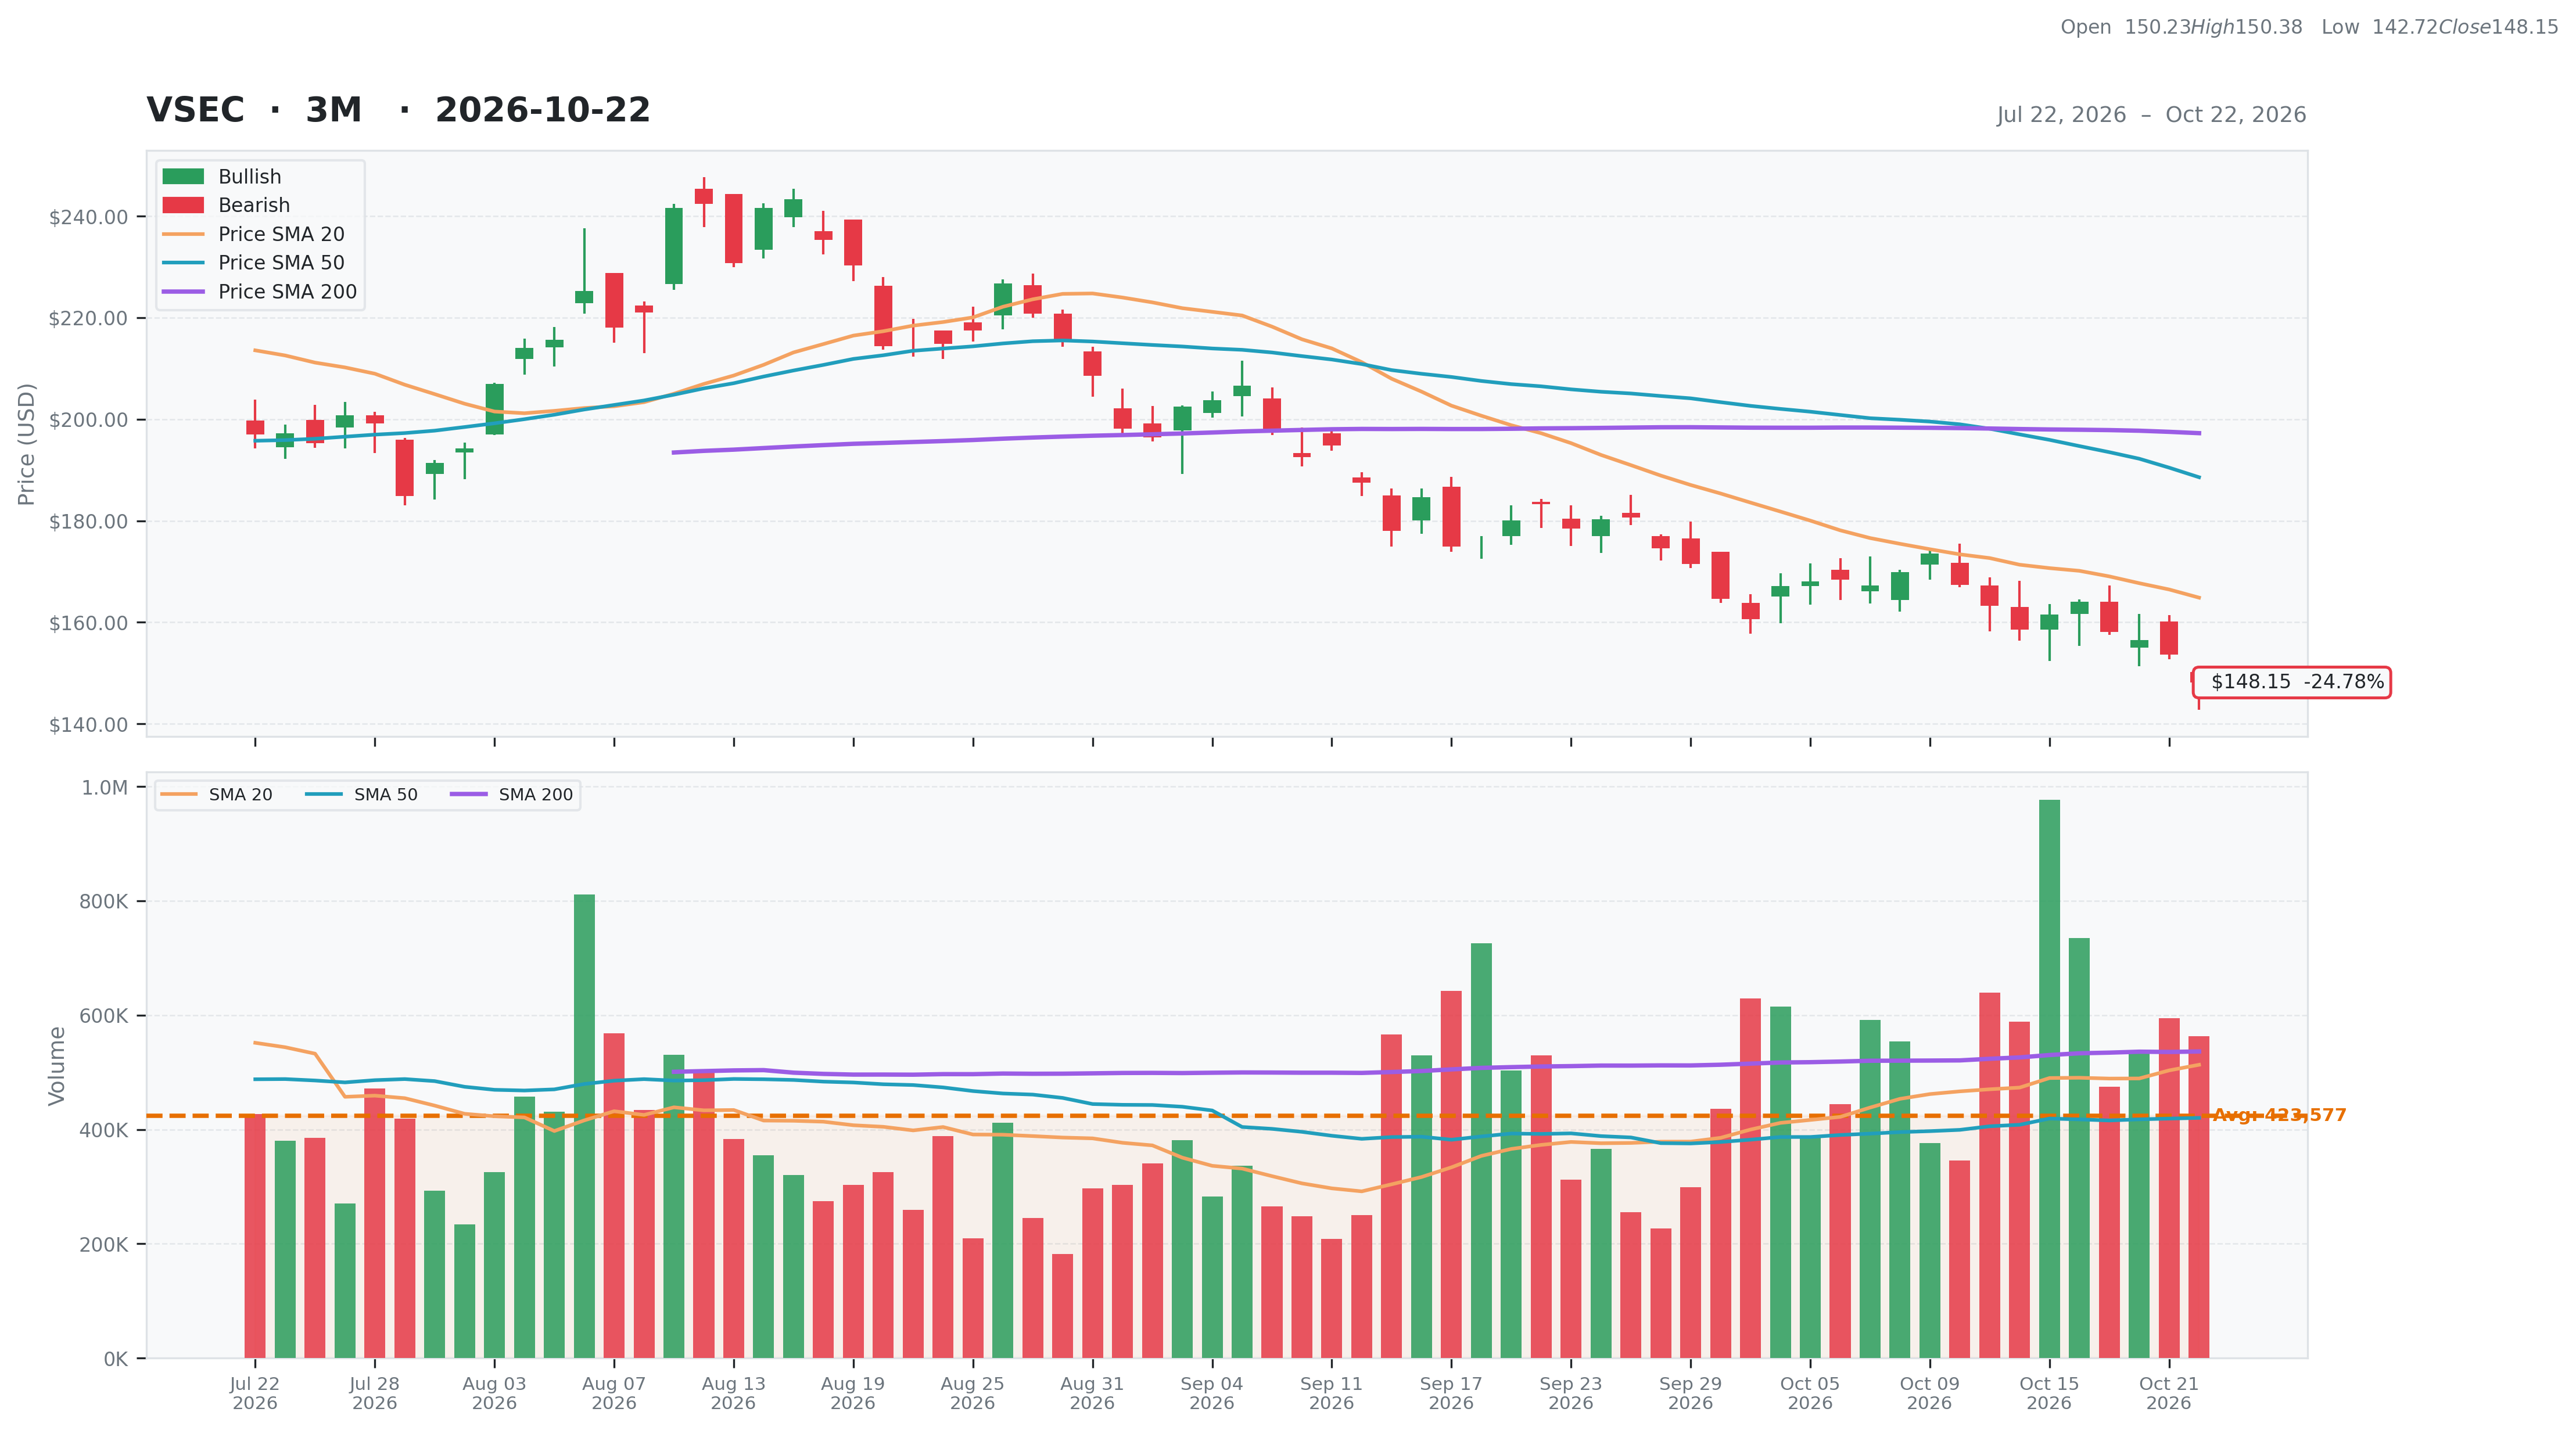
Industrials • Aerospace & Defense • $148.15 • MCap: 4,604,900,864
https://www.vsecorp.com • VSE Corporation engages in providing aviation aftermarket parts distribution and maintenance, repair, and overhaul services for air transportation assets for commercial and government markets. It offers its services to global client base of commercial airlines, regional airlines, air cargo transporters, MRO integrators and providers, aviation manufacturers, corporate and private aircraft owners, and fixed-base operators. The company was incorporated in 1959 and is headquartered in Miramar, Florida.
Ex-AAII
| Score | Price | 52 Week & Averages | Relative Strength | Risk | |||||
|---|---|---|---|---|---|---|---|---|---|
| Total | 52 | Current | $148.15 | 52W High | $243.33 -39.11% | Relative Strength | -0.23 | Beta | 1.27 |
| Business Quality | 8 | Weekly | $161.55 -8.29% | 52W Low | $148.15 0.00% | 3M | -0.24 | Short % | 0.08 |
| Financial Strength | 13 | Monthly | $183.30 -19.18% | Above 50DMA | $188.58 -21.44% | 6M | -0.19 | Risk Score | 1 |
| Growth Outlook | 15 | Quarterly | $195.30 -24.14% | Above 200DMA | $197.27 -24.90% | 9M | -0.30 | ||
| Momentum | 3 | Yearly | $179.15 -17.31% | 12M | -0.19 | ||||
| Valuation | Financial Strength | Growth/Profitability | |||
|---|---|---|---|---|---|
| Trailing P/E | 52.42 | Cash | 75M | Revenue Growth | 0.65% |
| Forward P/E | 19.81 | Debt | 1,026M | Earnings Growth | 4.88% |
| PEG Ratio | 3.00 | Debt/Equity | 34.97 | Qtr Earnings Growth | 7.92% |
| Price/Sales | 3.39 | Current Ratio | 3.77 | Gross Margin | 0.16% |
| Price/Book | 1.76 | Quick Ratio | 1.16 | Operating Margin | 0.13% |
| EV/Revenue | 4.51 | Operating CF | 27M | Profit Margin | 0.06% |
| EV/EBITDA | 27.58 | Free CF | -261M | EBITDA Margin | 0.16% |
| Ent Value | 6,120M | Return on Assets | 0.03% | ||
| Return on Equity | 0.04% | ||||
| Technical | Volume & Bollinger Bands | Analyst | |||
|---|---|---|---|---|---|
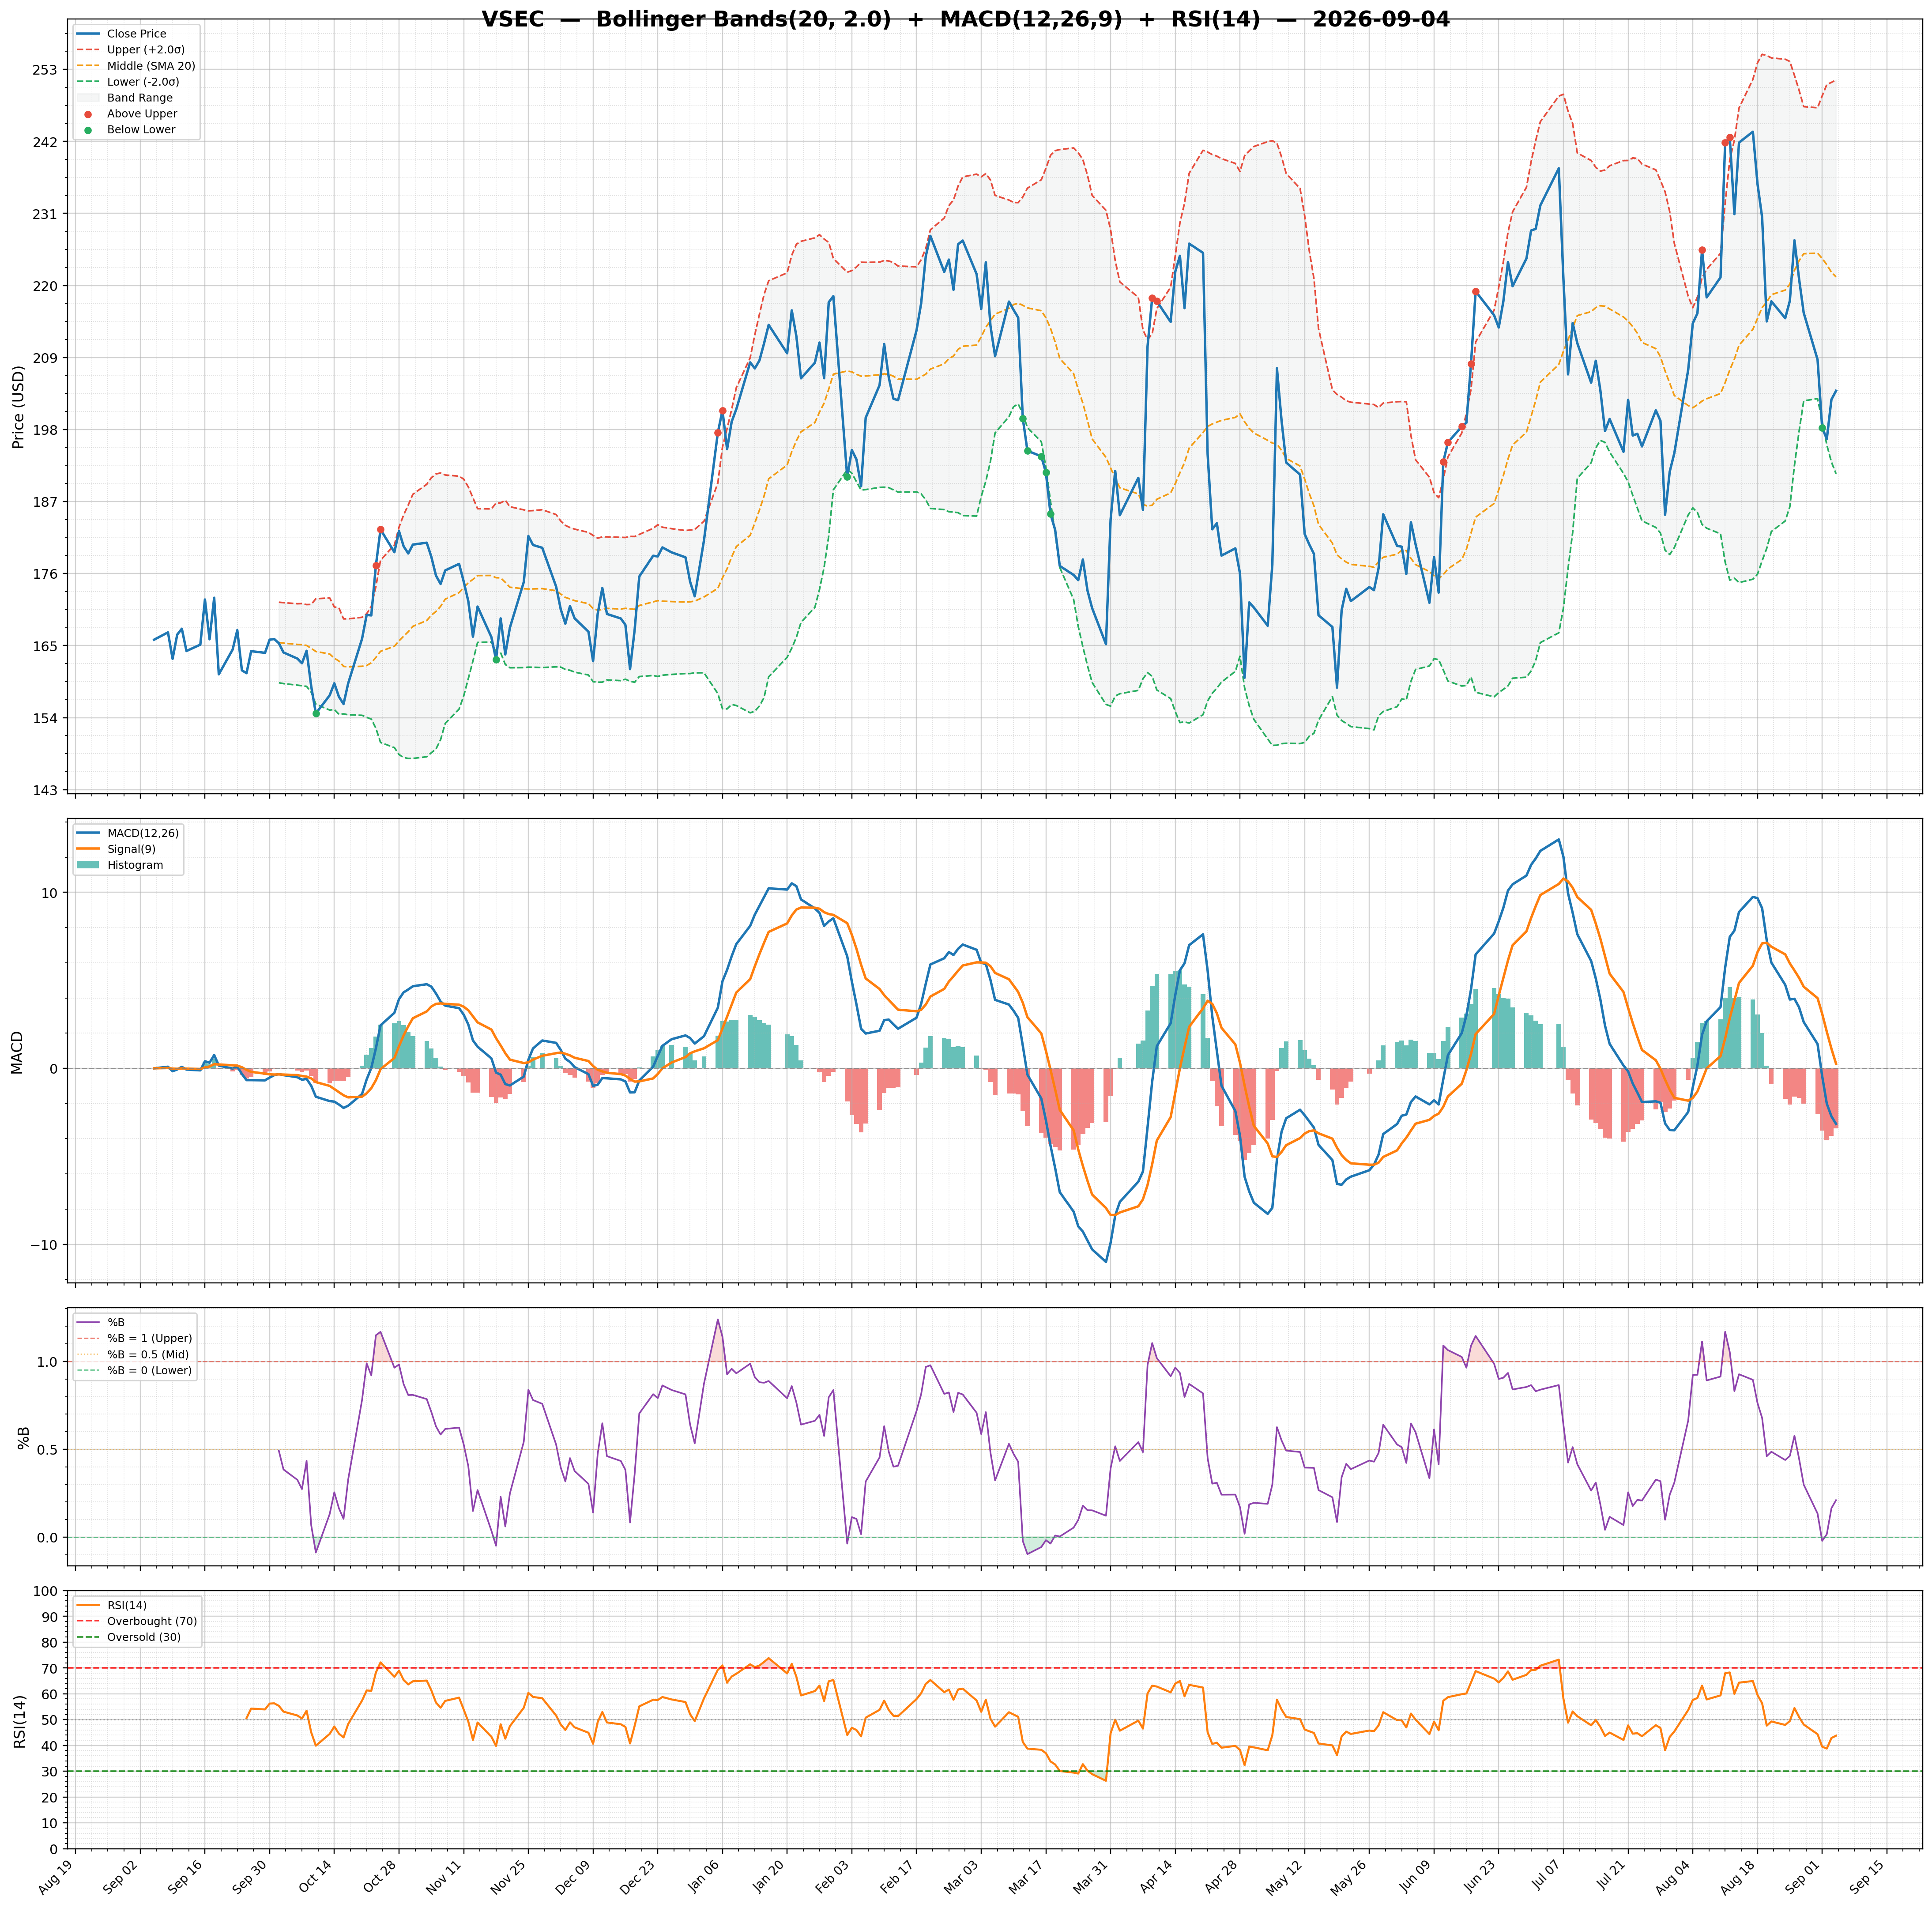
| RSI | 29.49 | Volume | 0.74M | Rating | strong_buy |
| Previous RSI | 32.67 | Avg Volume 20D | 0.51M | Target Mean | $257.11 |
| RSI Trend | Down | Relative Volume | 1.13 | Target High | $280.00 |
| MACD | -8.92 | Lower Band | 149.52 | Target Low | $215.00 |
| MACD Signal | -8.53 | Middle Band | 164.86 | Target Median | $265.00 |
| Histogram | -0.39 | Upper Band | 180.21 | Analysts | 9 |
| Previous Histogram | 0.03 | Bandwidth | 18.610 | Upside | 56.70% |
| Histogram Trend | Decreasing | %B | -0.04 | ||