Workiva Inc. (WK)
Technology • Software - Application • $85.04 • MCap: 4,098,105,600
https://www.workiva.com • Workiva Inc., together with its subsidiaries, provides cloud-based reporting solutions in the United States and internationally. The company provides Workiva platform, a multi-tenant cloud software that provides data-linking capabilities; audit trail services; administrators access management; and connects and transforms data from various enterprise resource planning, human capital management, and customer relationship management systems, as well as other third-party cloud and on-premise applications. It serves public and private companies, government agencies, and higher-education institutions. Workiva Inc. was founded in 2008 and is headquartered in Ames, Iowa.
Watch List
ET
| Score | Price | 52 Week & Averages | Relative Strength | Risk | |||||
|---|---|---|---|---|---|---|---|---|---|
| Total | 51 | Current | $85.04 | 52W High | $93.31 -8.86% | Relative Strength | 0.37 | Beta | 0.52 |
| Business Quality | 10 | Weekly | $77.21 10.14% | 52W Low | $44.31 91.92% | 3M | 0.62 | Short % | 0.07 |
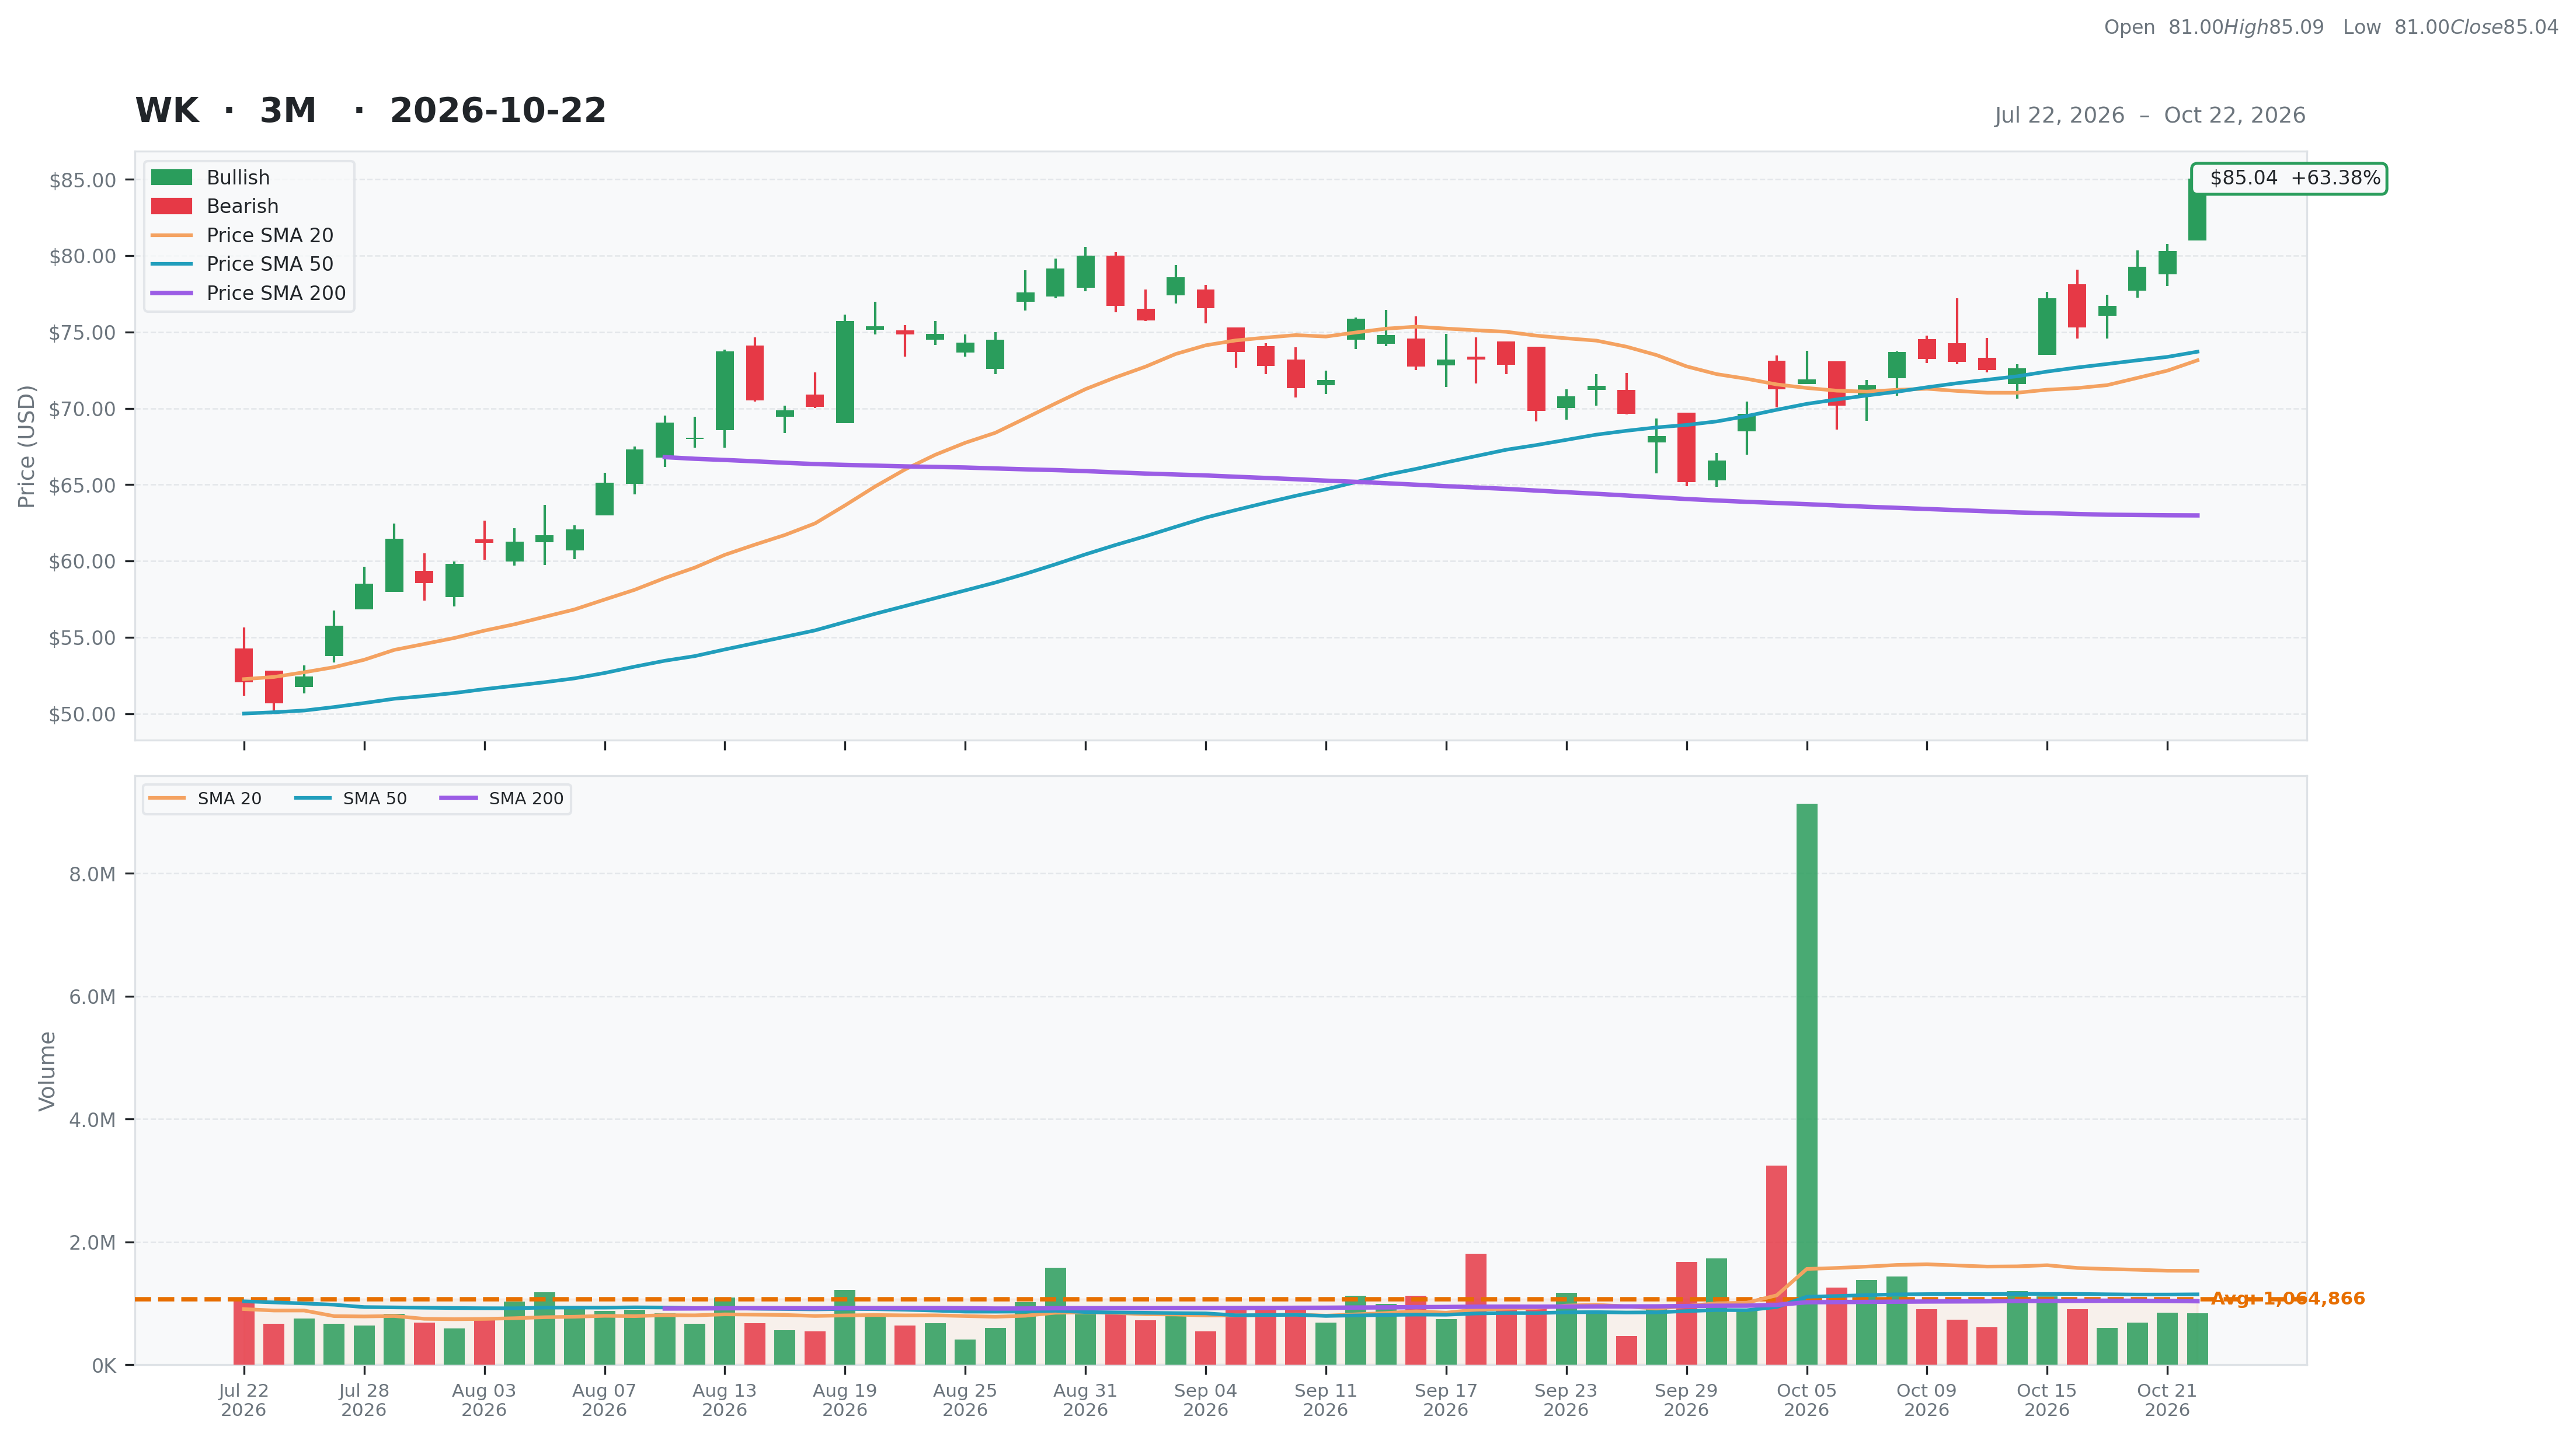
| Financial Strength | 13 | Monthly | $69.83 21.78% | Above 50DMA | $73.71 15.37% | 6M | 0.63 | Risk Score | 8 |
| Growth Outlook | 5 | Quarterly | $52.42 62.23% | Above 200DMA | $62.99 35.02% | 9M | 0.04 | ||
| Momentum | 5 | Yearly | $88.52 -3.93% | 12M | -0.05 | ||||
| Valuation | Financial Strength | Growth/Profitability | |||
|---|---|---|---|---|---|
| Trailing P/E | 89.65 | Cash | 815M | Revenue Growth | 0.19% |
| Forward P/E | 18.60 | Debt | 793M | Earnings Growth | N/A |
| PEG Ratio | N/A | Debt/Equity | N/A | Qtr Earnings Growth | N/A |
| Price/Sales | 4.24 | Current Ratio | 1.47 | Gross Margin | 0.80% |
| Price/Book | -41.96 | Quick Ratio | 1.35 | Operating Margin | 0.05% |
| EV/Revenue | 4.22 | Operating CF | 202M | Profit Margin | 0.05% |
| EV/EBITDA | 96.96 | Free CF | 169M | EBITDA Margin | 0.04% |
| Ent Value | 4,076M | Return on Assets | 0.01% | ||
| Return on Equity | N/A | ||||
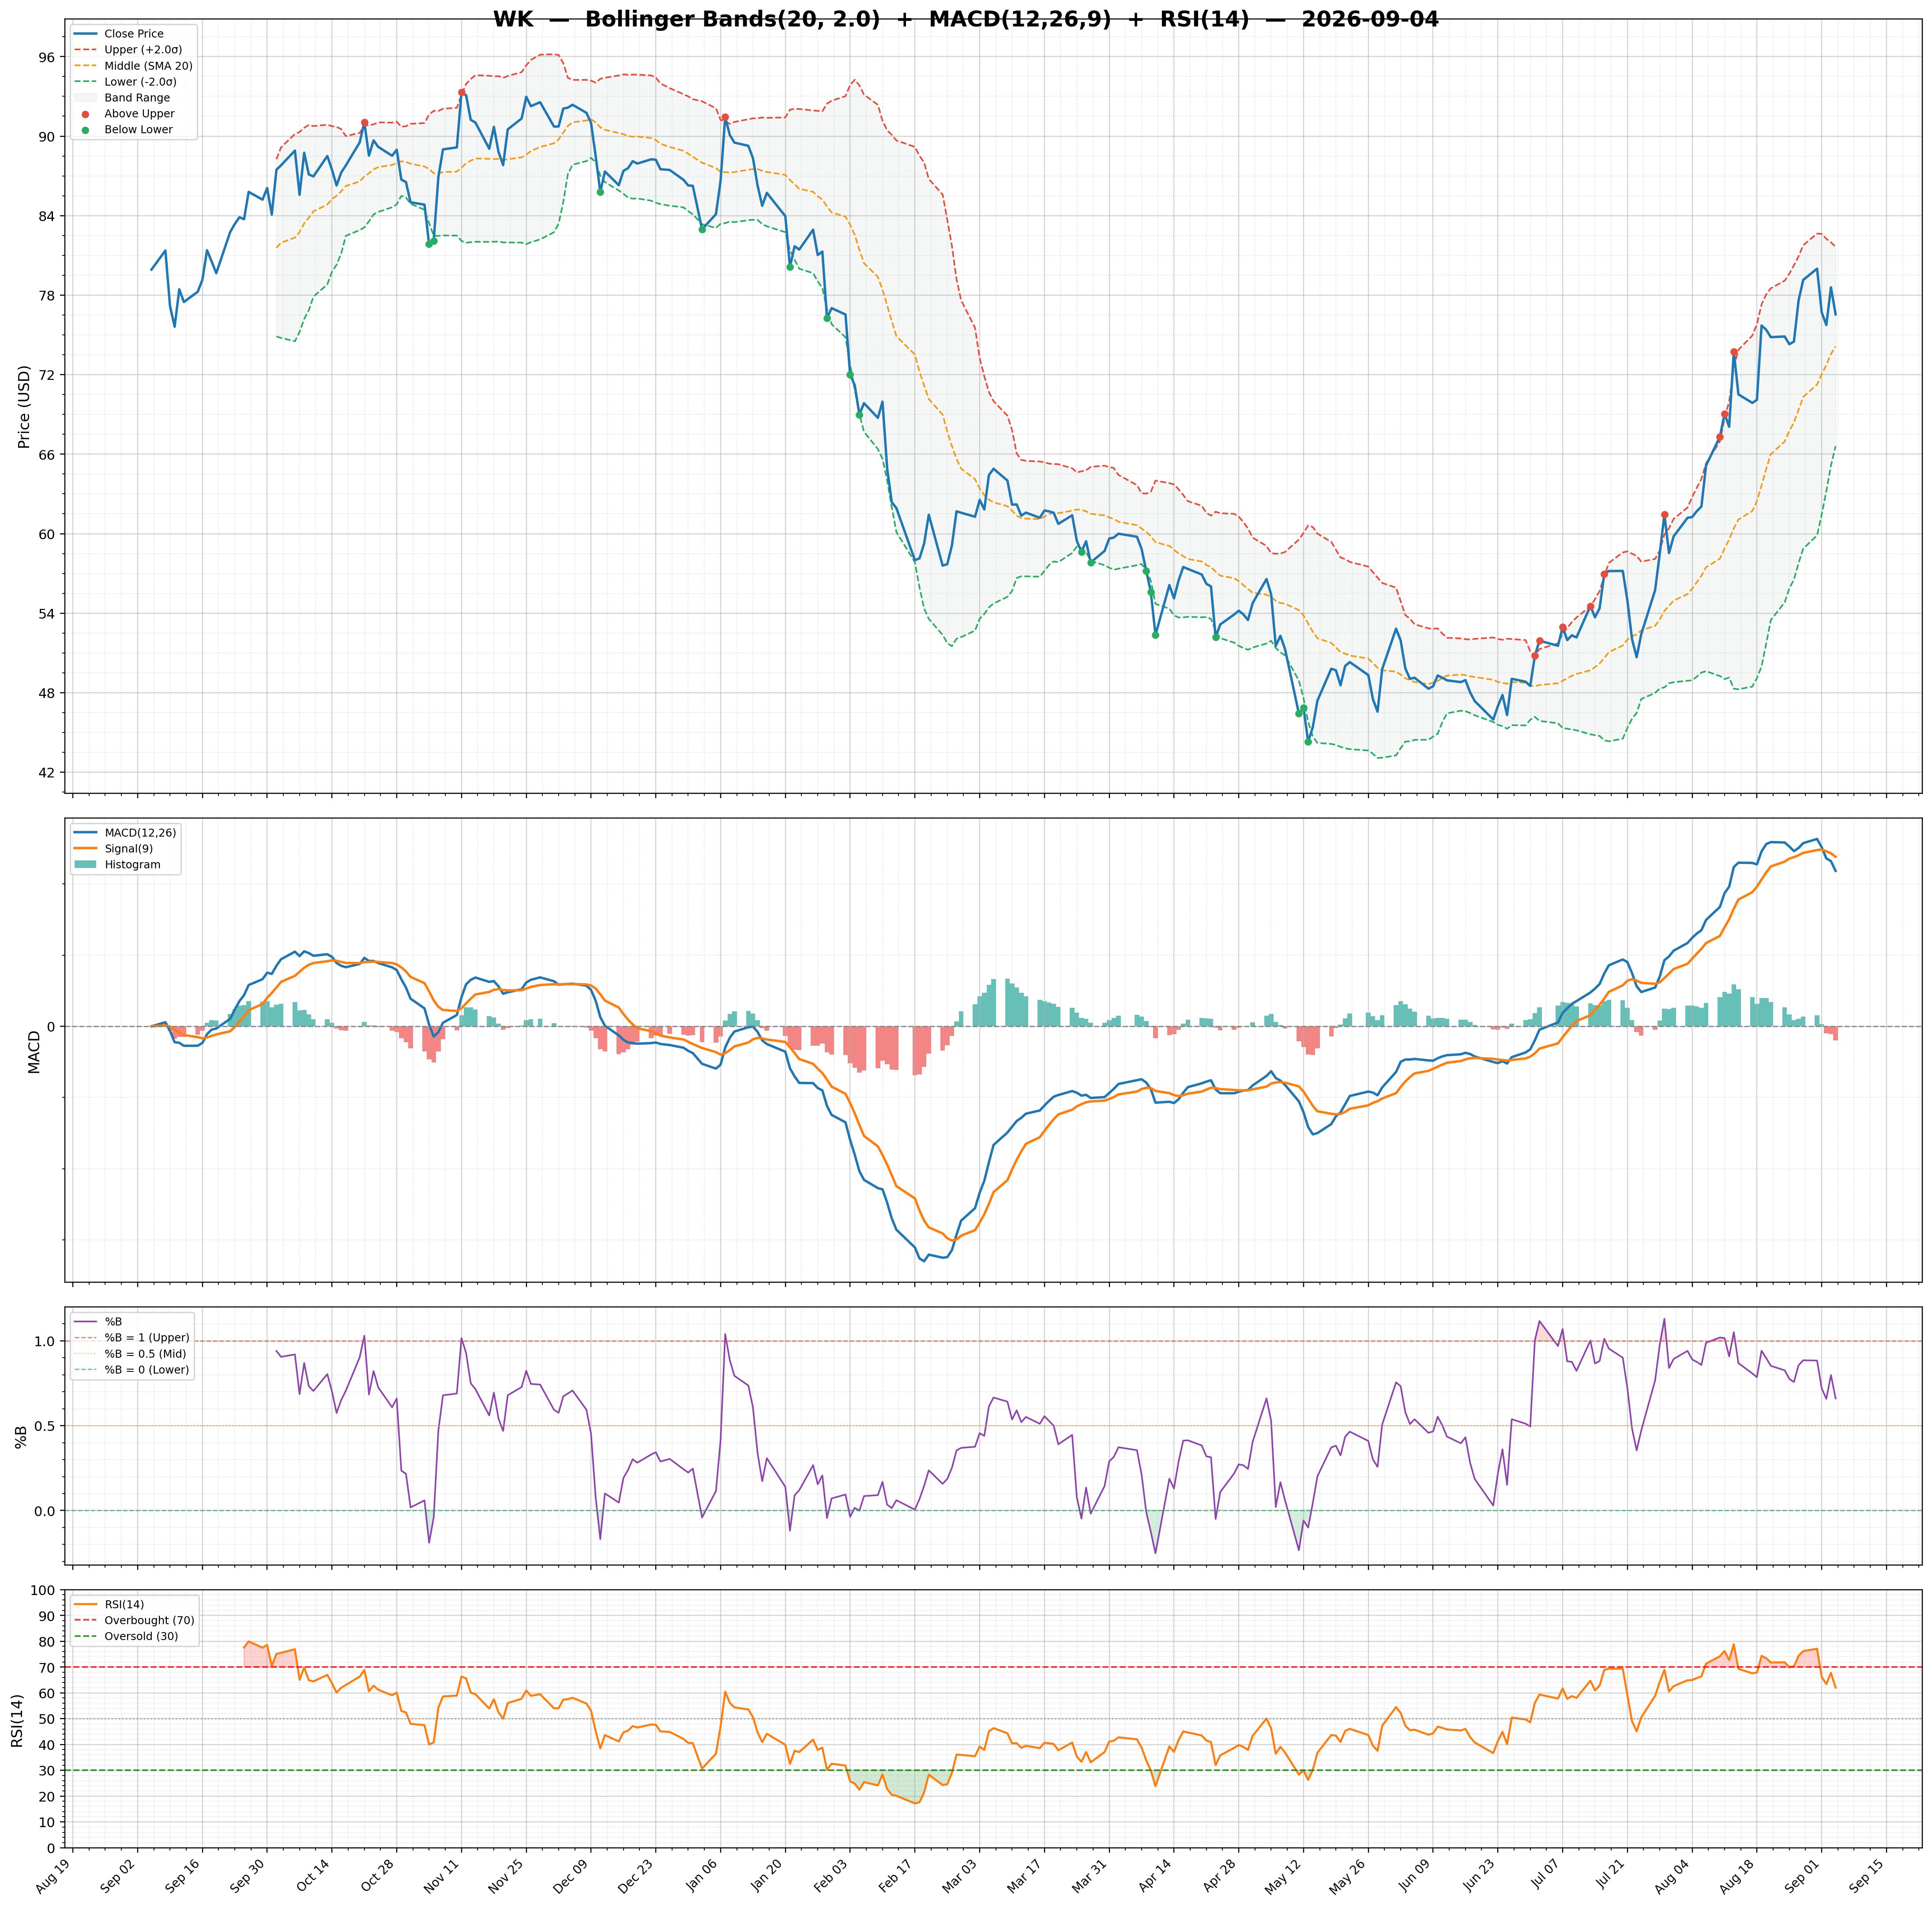
| Technical | Volume & Bollinger Bands | Analyst | |||
|---|---|---|---|---|---|
| RSI | 72.82 | Volume | 0.78M | Rating | strong_buy |
| Previous RSI | 66.58 | Avg Volume 20D | 1.53M | Target Mean | $89.80 |
| RSI Trend | Up | Relative Volume | 0.61 | Target High | $105.00 |
| MACD | 2.48 | Lower Band | 63.54 | Target Low | $80.00 |
| MACD Signal | 1.25 | Middle Band | 73.15 | Target Median | $90.00 |
| Histogram | 1.23 | Upper Band | 82.76 | Analysts | 10 |
| Previous Histogram | 0.91 | Bandwidth | 26.270 | Upside | 19.24% |
| Histogram Trend | Increasing | %B | 1.12 | ||