Willdan Group, Inc. (WLDN)
Industrials • Engineering & Construction • $72.06 • MCap: 1,100,214,016
https://www.willdan.com • Willdan Group, Inc., a technical services company, focuses on the provision of energy and infrastructure solutions in the United States and Canada. The company operates in two segments: Energy, and Engineering and Consulting. The Energy segment offers in-depth energy planning studies, economic analysis, modeling and forecasting software, decarbonization, program design and implementation, energy efficiency, turnkey energy and infrastructure projects, grid modernization, and utility-scale electrical engineering and construction management services. It serves investor-owned and municipal utilities, as well as investors and hyperscalers, and state and local governments. The Engineering and Consulting segment provides municipal and civil engineering, building and safety, code enforcement, fire plan and inspection, city engineering, construction management, design engineering, planning, and financial and municipal advisory services. It serves state and local governments, school districts, and utility districts. The company was founded in 1964 and is headquartered in Anaheim, California.
Reversal Strategy
Notes
10/23/2026
google - buy
| Score | Price | 52 Week & Averages | Relative Strength | Risk | |||||
|---|---|---|---|---|---|---|---|---|---|
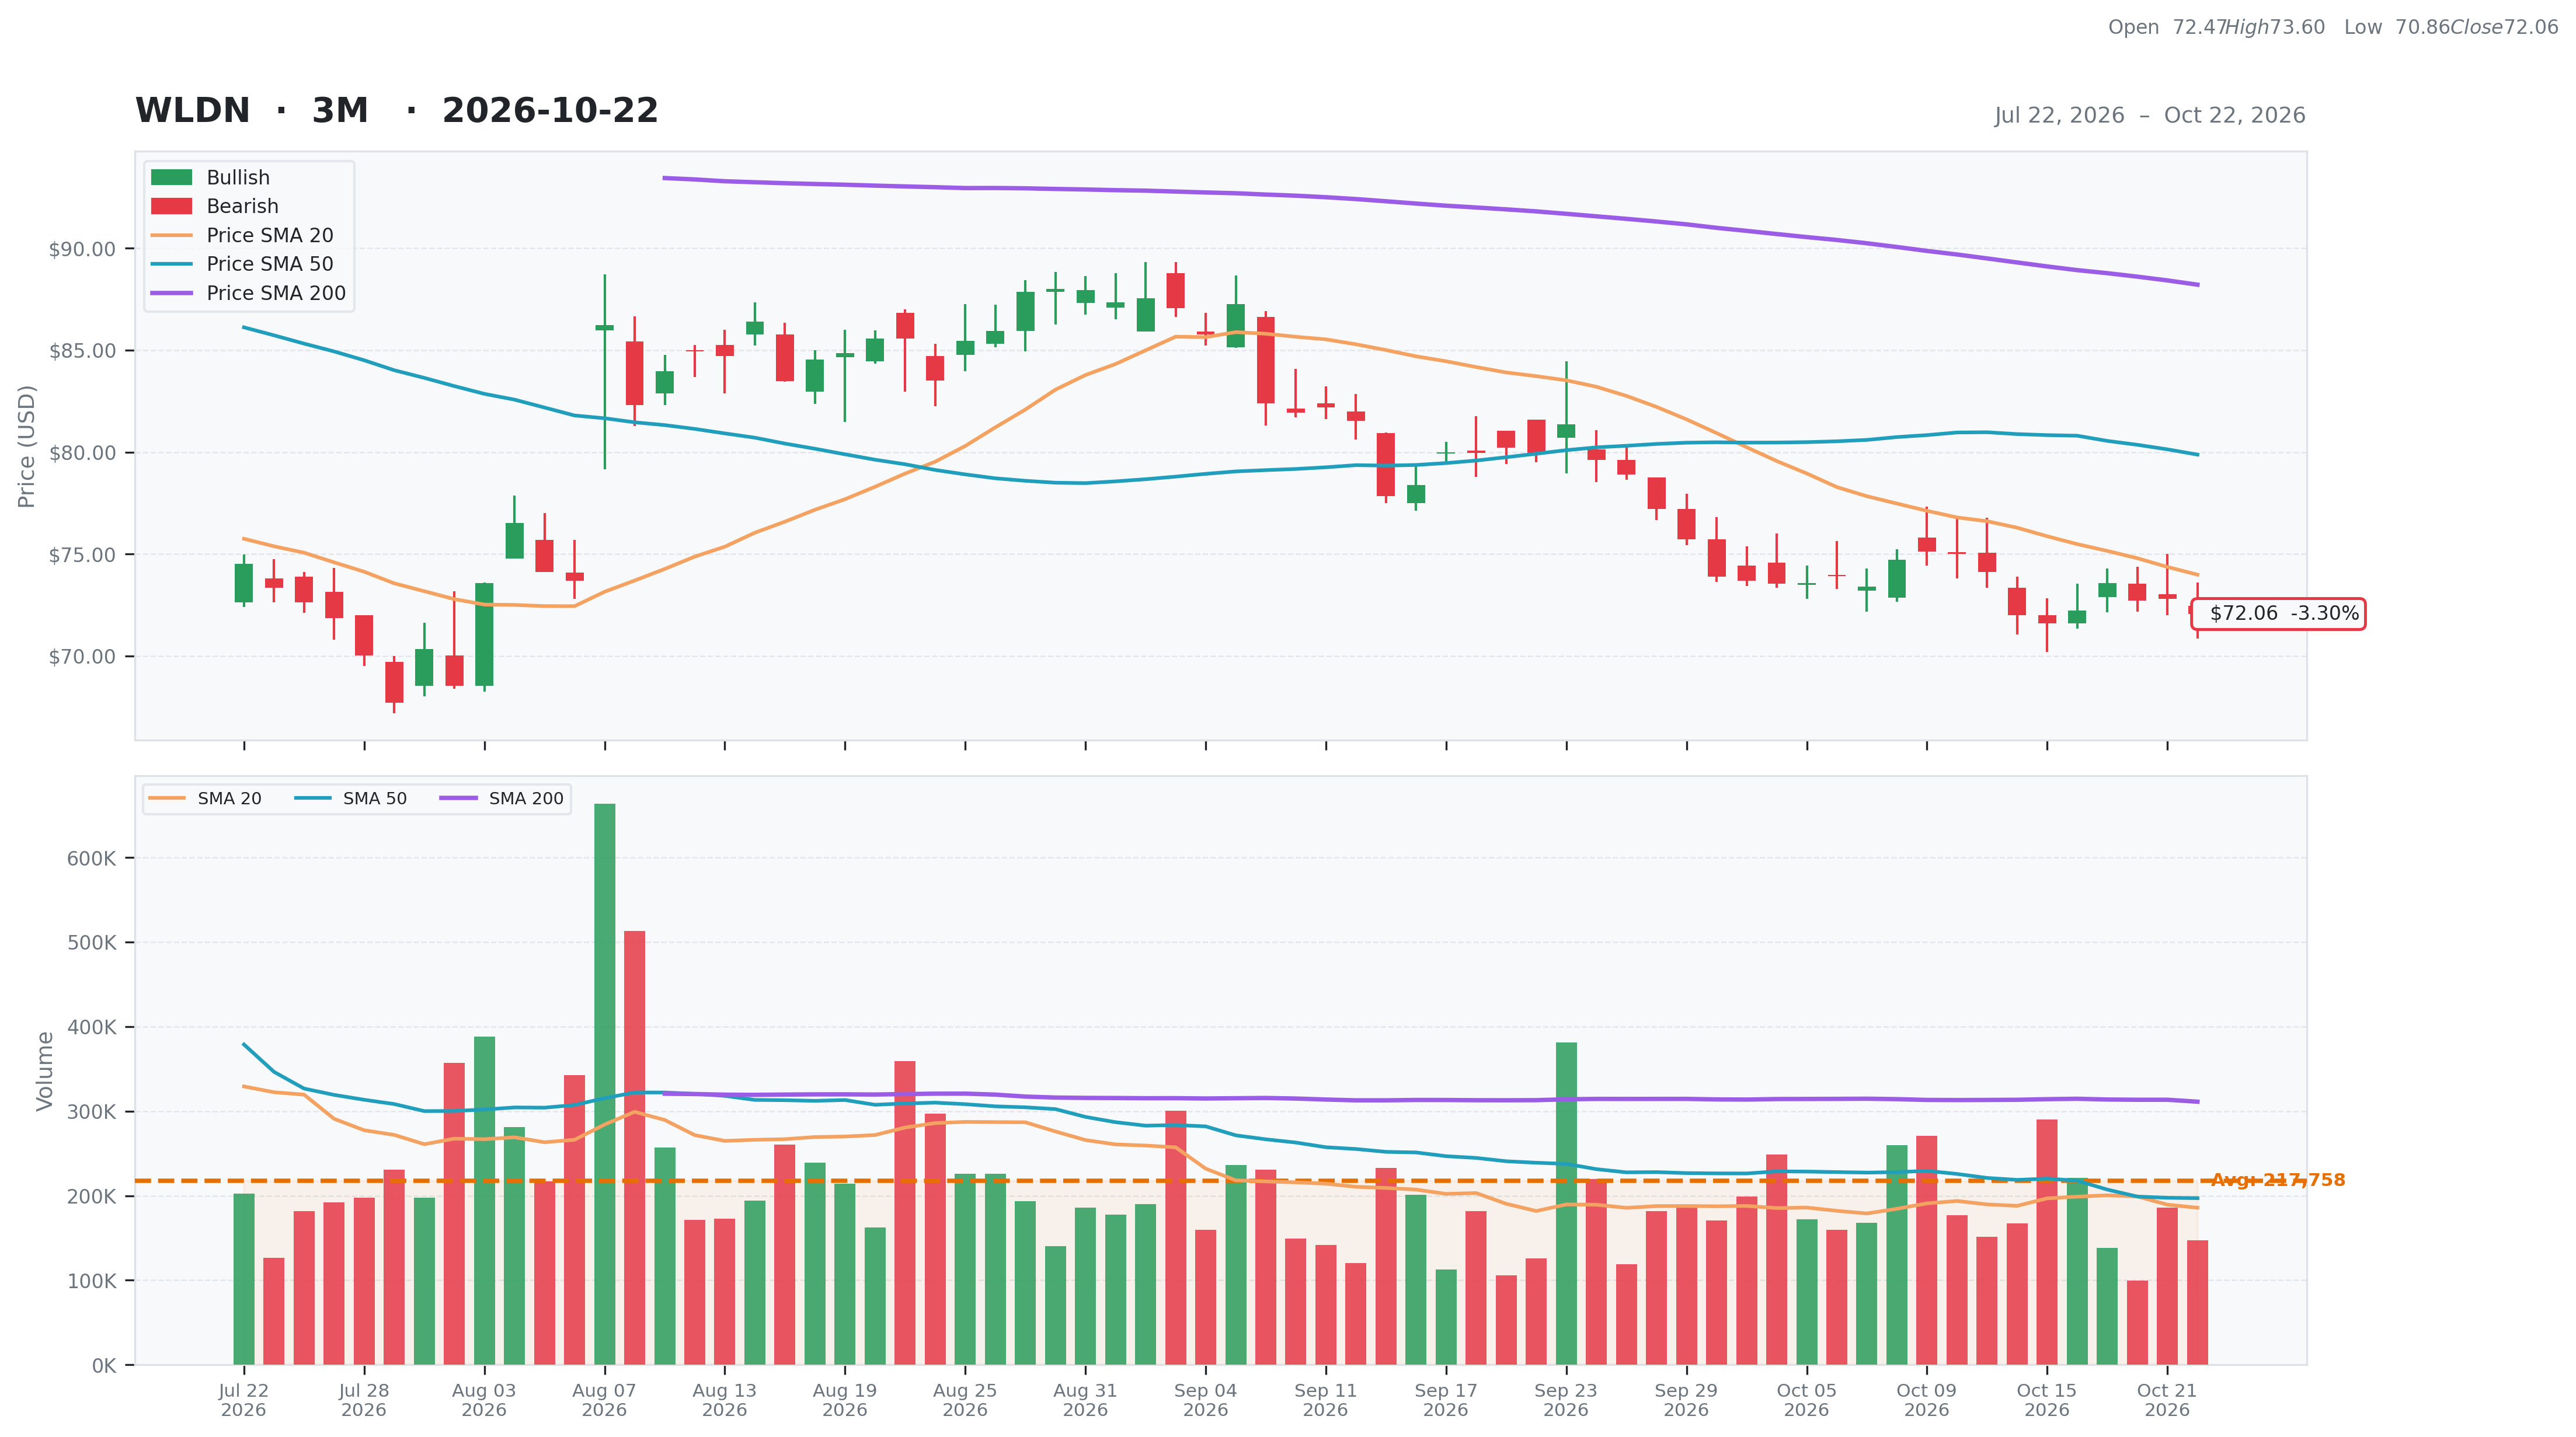
| Total | 71 | Current | $72.06 | 52W High | $134.94 -46.60% | Relative Strength | -0.17 | Beta | 1.20 |
| Business Quality | 11 | Weekly | $71.61 0.63% | 52W Low | $66.91 7.70% | 3M | -0.01 | Short % | 0.12 |
| Financial Strength | 19 | Monthly | $79.89 -9.80% | Above 50DMA | $79.88 -9.79% | 6M | -0.06 | Risk Score | 4 |
| Growth Outlook | 15 | Quarterly | $72.63 -0.78% | Above 200DMA | $88.21 -18.31% | 9M | -0.45 | ||
| Momentum | 2 | Yearly | $96.22 -25.11% | 12M | -0.30 | ||||
| Valuation | Financial Strength | Growth/Profitability | |||
|---|---|---|---|---|---|
| Trailing P/E | 16.96 | Cash | 35M | Revenue Growth | 0.33% |
| Forward P/E | 13.31 | Debt | 89M | Earnings Growth | 0.53% |
| PEG Ratio | 0.48 | Debt/Equity | 25.45 | Qtr Earnings Growth | 0.58% |
| Price/Sales | 1.48 | Current Ratio | 1.37 | Gross Margin | 0.38% |
| Price/Book | 3.13 | Quick Ratio | 1.30 | Operating Margin | 0.09% |
| EV/Revenue | 1.56 | Operating CF | 71M | Profit Margin | 0.09% |
| EV/EBITDA | 15.67 | Free CF | 50M | EBITDA Margin | 0.10% |
| Ent Value | 1,155M | Return on Assets | 0.06% | ||
| Return on Equity | 0.21% | ||||
| Technical | Volume & Bollinger Bands | Analyst | |||
|---|---|---|---|---|---|
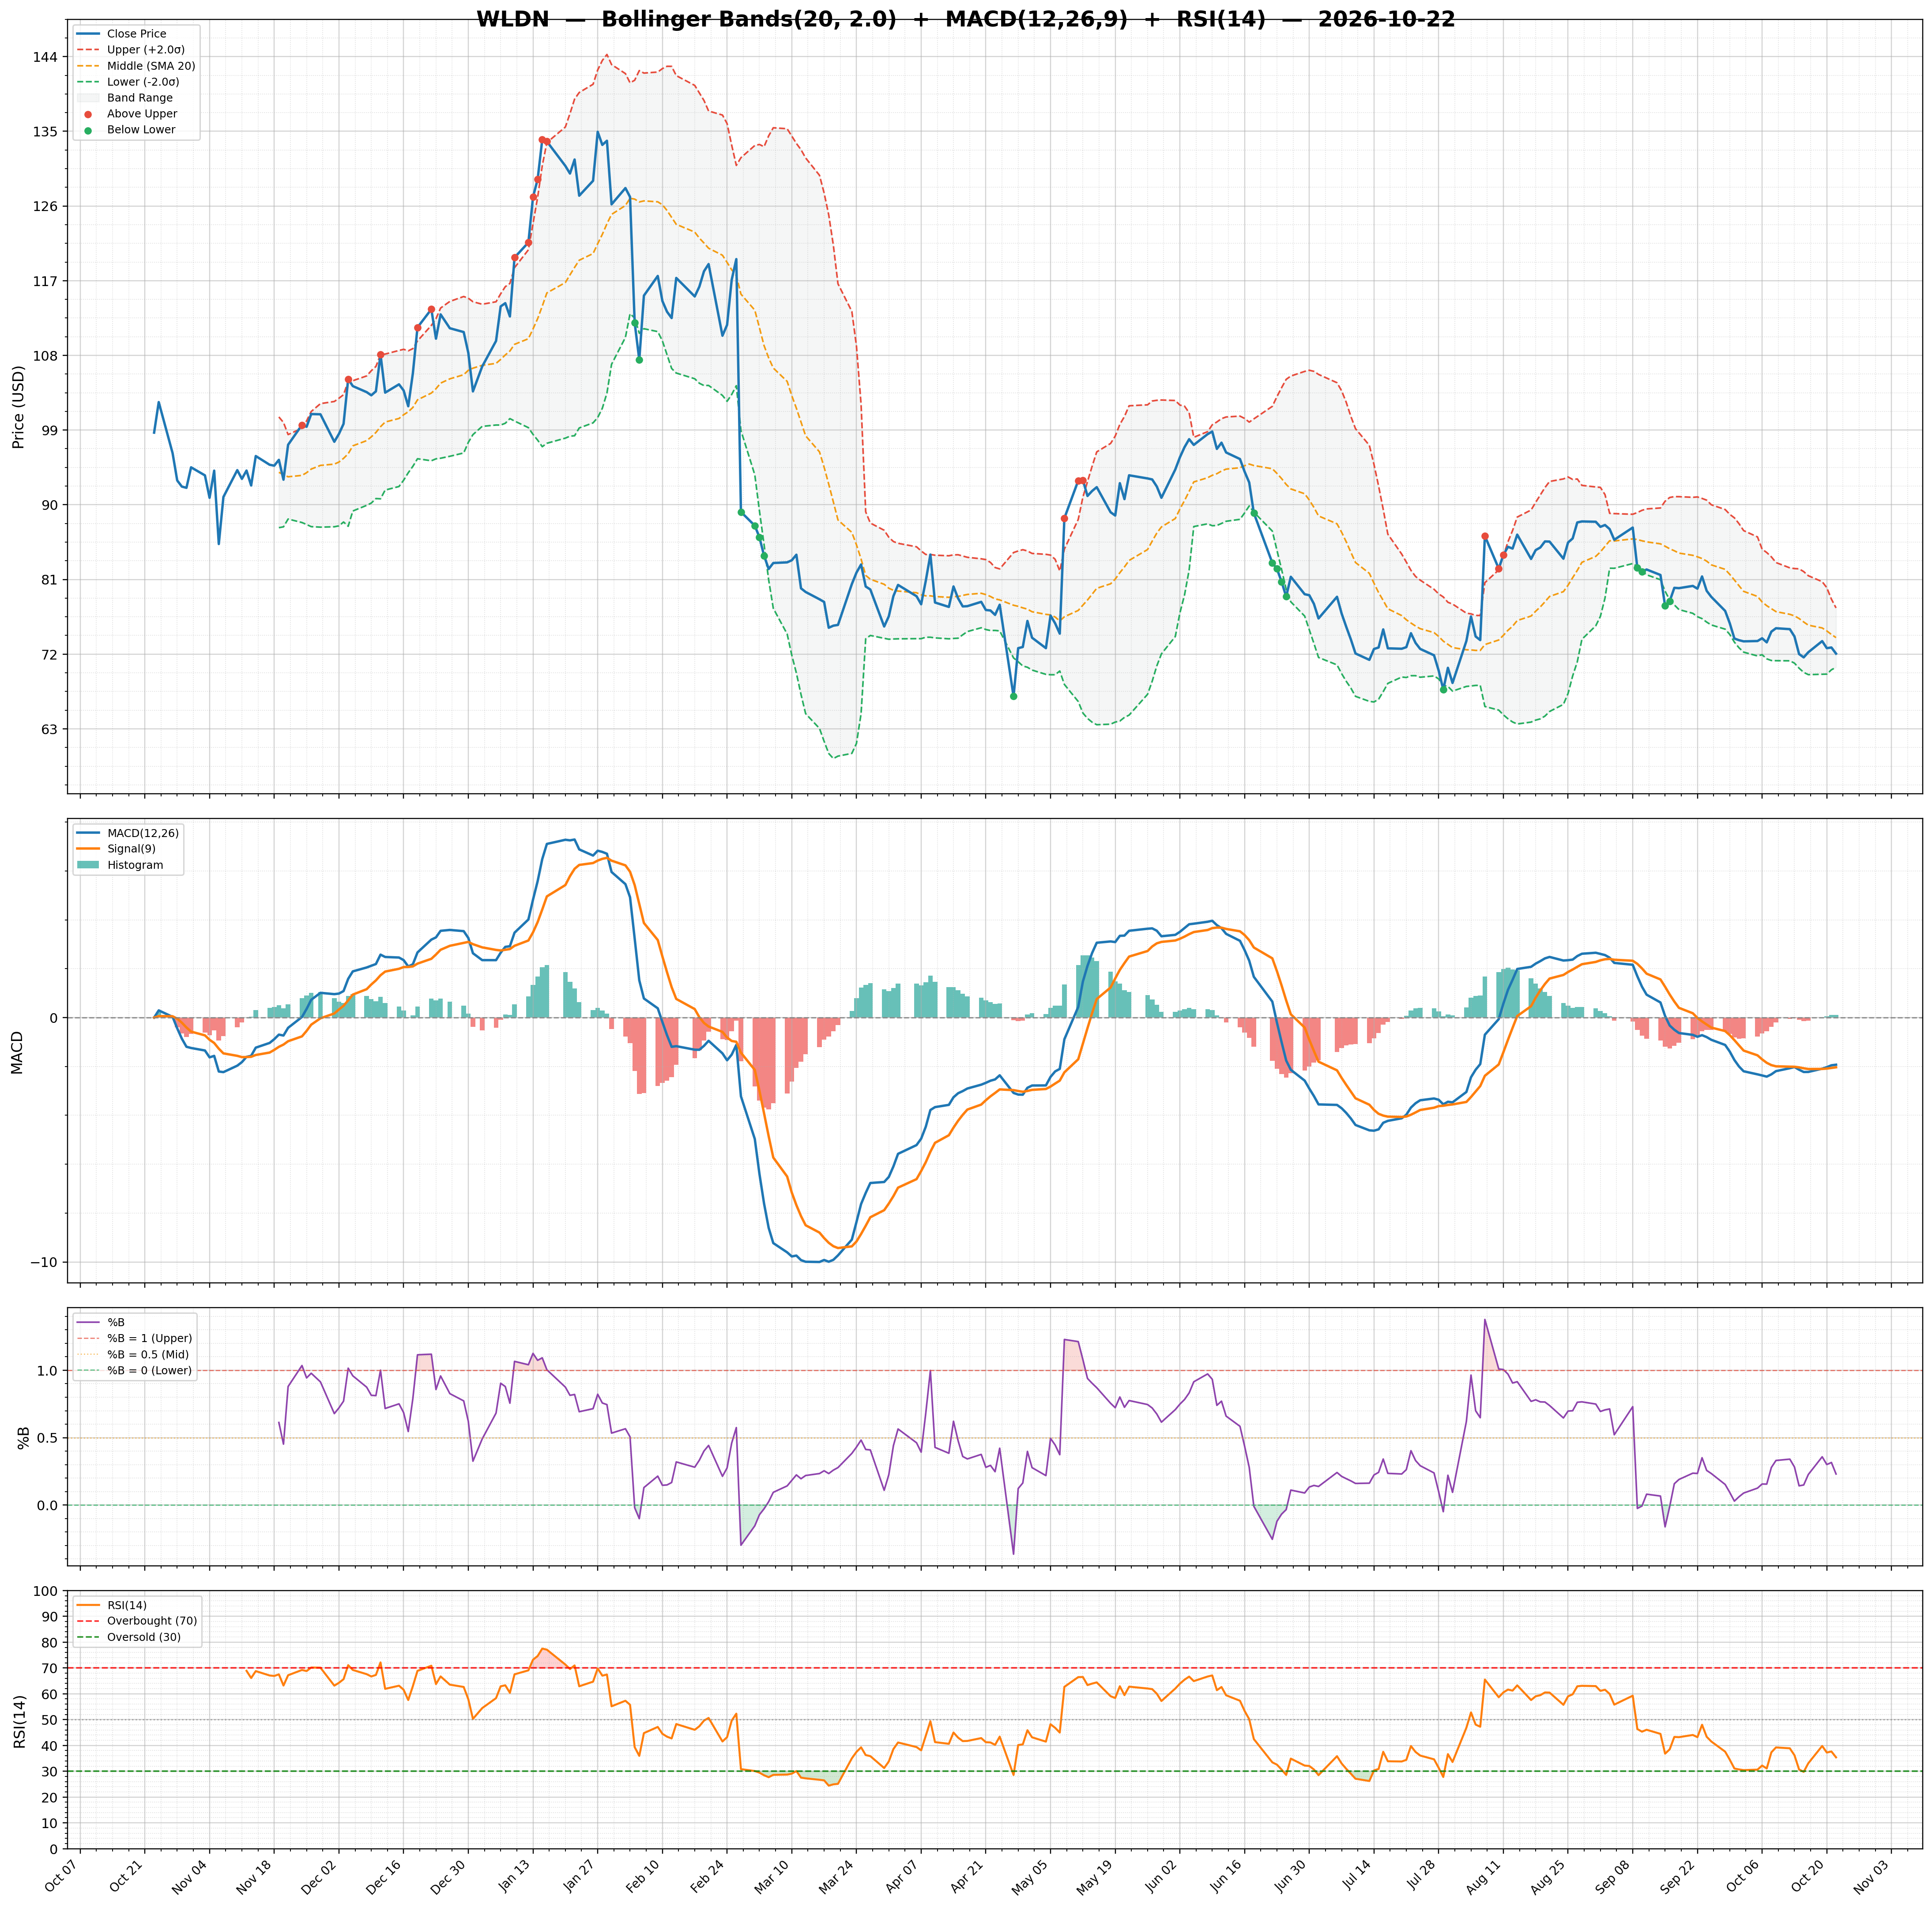
| RSI | 35.39 | Volume | 0.22M | Rating | strong_buy |
| Previous RSI | 37.66 | Avg Volume 20D | 0.19M | Target Mean | $137.50 |
| RSI Trend | Down | Relative Volume | 0.80 | Target High | $145.00 |
| MACD | -1.93 | Lower Band | 70.41 | Target Low | $130.00 |
| MACD Signal | -2.04 | Middle Band | 73.99 | Target Median | $137.50 |
| Histogram | 0.10 | Upper Band | 77.57 | Analysts | 2 |
| Previous Histogram | 0.11 | Bandwidth | 9.670 | Upside | 90.36% |
| Histogram Trend | Decreasing | %B | 0.23 | ||