Willis Lease Finance Corporatio (WLFC)
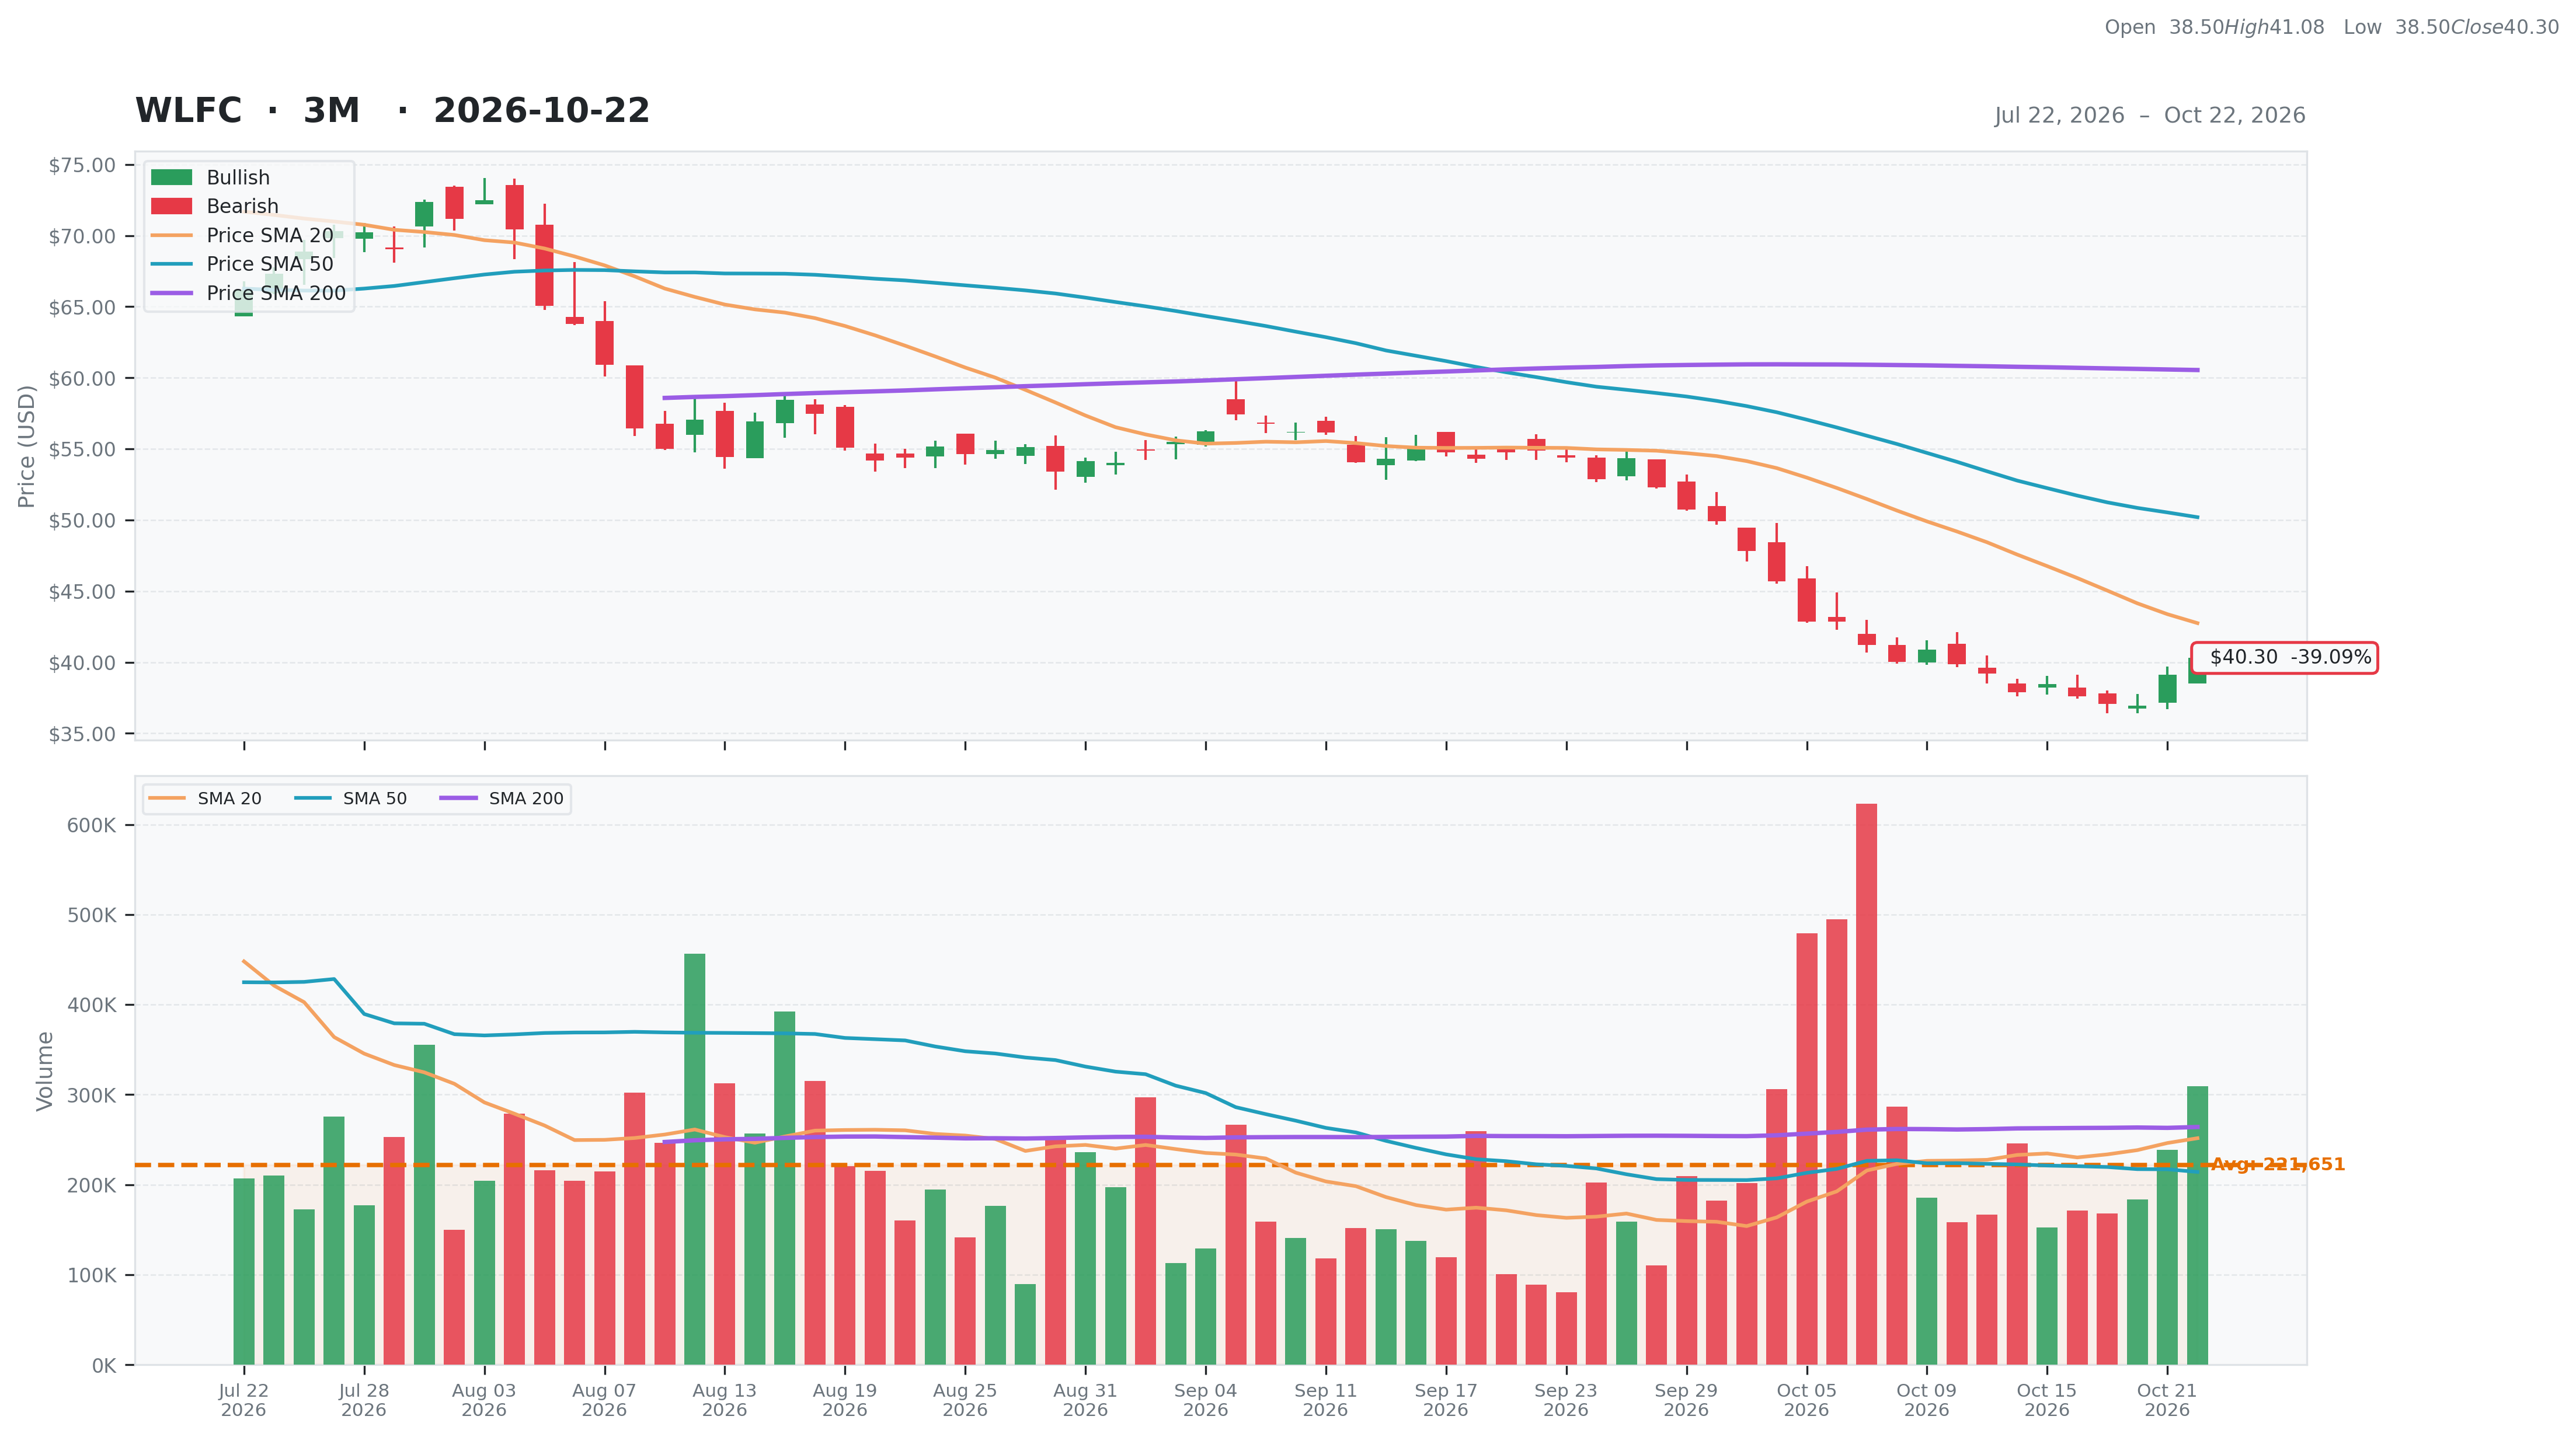
Industrials • Rental & Leasing Services • $40.3 • MCap: 795,230,080
https://www.wlfc.global • Willis Lease Finance Corporation, together with its subsidiaries, operates as a lessor and servicer of commercial aircraft and aircraft engines worldwide. It operates in two segments, Leasing and Related Operations, and Spare Parts Sales. The company engages in acquiring and leasing commercial aircraft, aircraft engines, and related aircraft equipment, as well as the purchase and resale of commercial aircraft engines and other aircraft equipment, and service and maintenance related businesses. It also purchases and resells after-market engine parts, whole engines, engine modules, and portable aircraft components. The company serves commercial aircraft operators, as well as maintenance, repair, and overhaul organizations. Willis Lease Finance Corporation was incorporated in 1985 and is headquartered in Coconut Creek, Florida.
Ex-AAII
| Score | Price | 52 Week & Averages | Relative Strength | Risk | |||||
|---|---|---|---|---|---|---|---|---|---|
| Total | 64 | Current | $40.30 | 52W High | $79.78 -49.49% | Relative Strength | -0.32 | Beta | 0.73 |
| Business Quality | 23 | Weekly | $38.45 4.81% | 52W Low | $36.96 9.04% | 3M | -0.41 | Short % | 0.2 |
| Financial Strength | 9 | Monthly | $54.89 -26.58% | Above 50DMA | $50.20 -19.72% | 6M | -0.36 | Risk Score | 10 |
| Growth Outlook | 4 | Quarterly | $68.89 -41.50% | Above 200DMA | $60.54 -33.44% | 9M | -0.36 | ||
| Momentum | 2 | Yearly | $42.86 -5.98% | 12M | -0.07 | ||||
| Valuation | Financial Strength | Growth/Profitability | |||
|---|---|---|---|---|---|
| Trailing P/E | 9.47 | Cash | 12M | Revenue Growth | 0.00% |
| Forward P/E | 5.47 | Debt | 2,348M | Earnings Growth | -0.53% |
| PEG Ratio | 0.94 | Debt/Equity | 303.39 | Qtr Earnings Growth | -0.50% |
| Price/Sales | 1.05 | Current Ratio | 1.54 | Gross Margin | 0.85% |
| Price/Book | 1.21 | Quick Ratio | 0.20 | Operating Margin | 0.38% |
| EV/Revenue | 4.24 | Operating CF | 272M | Profit Margin | 0.12% |
| EV/EBITDA | 8.02 | Free CF | 563M | EBITDA Margin | 0.53% |
| Ent Value | 3,196M | Return on Assets | 0.05% | ||
| Return on Equity | 0.13% | ||||
| Technical | Volume & Bollinger Bands | Analyst | |||
|---|---|---|---|---|---|
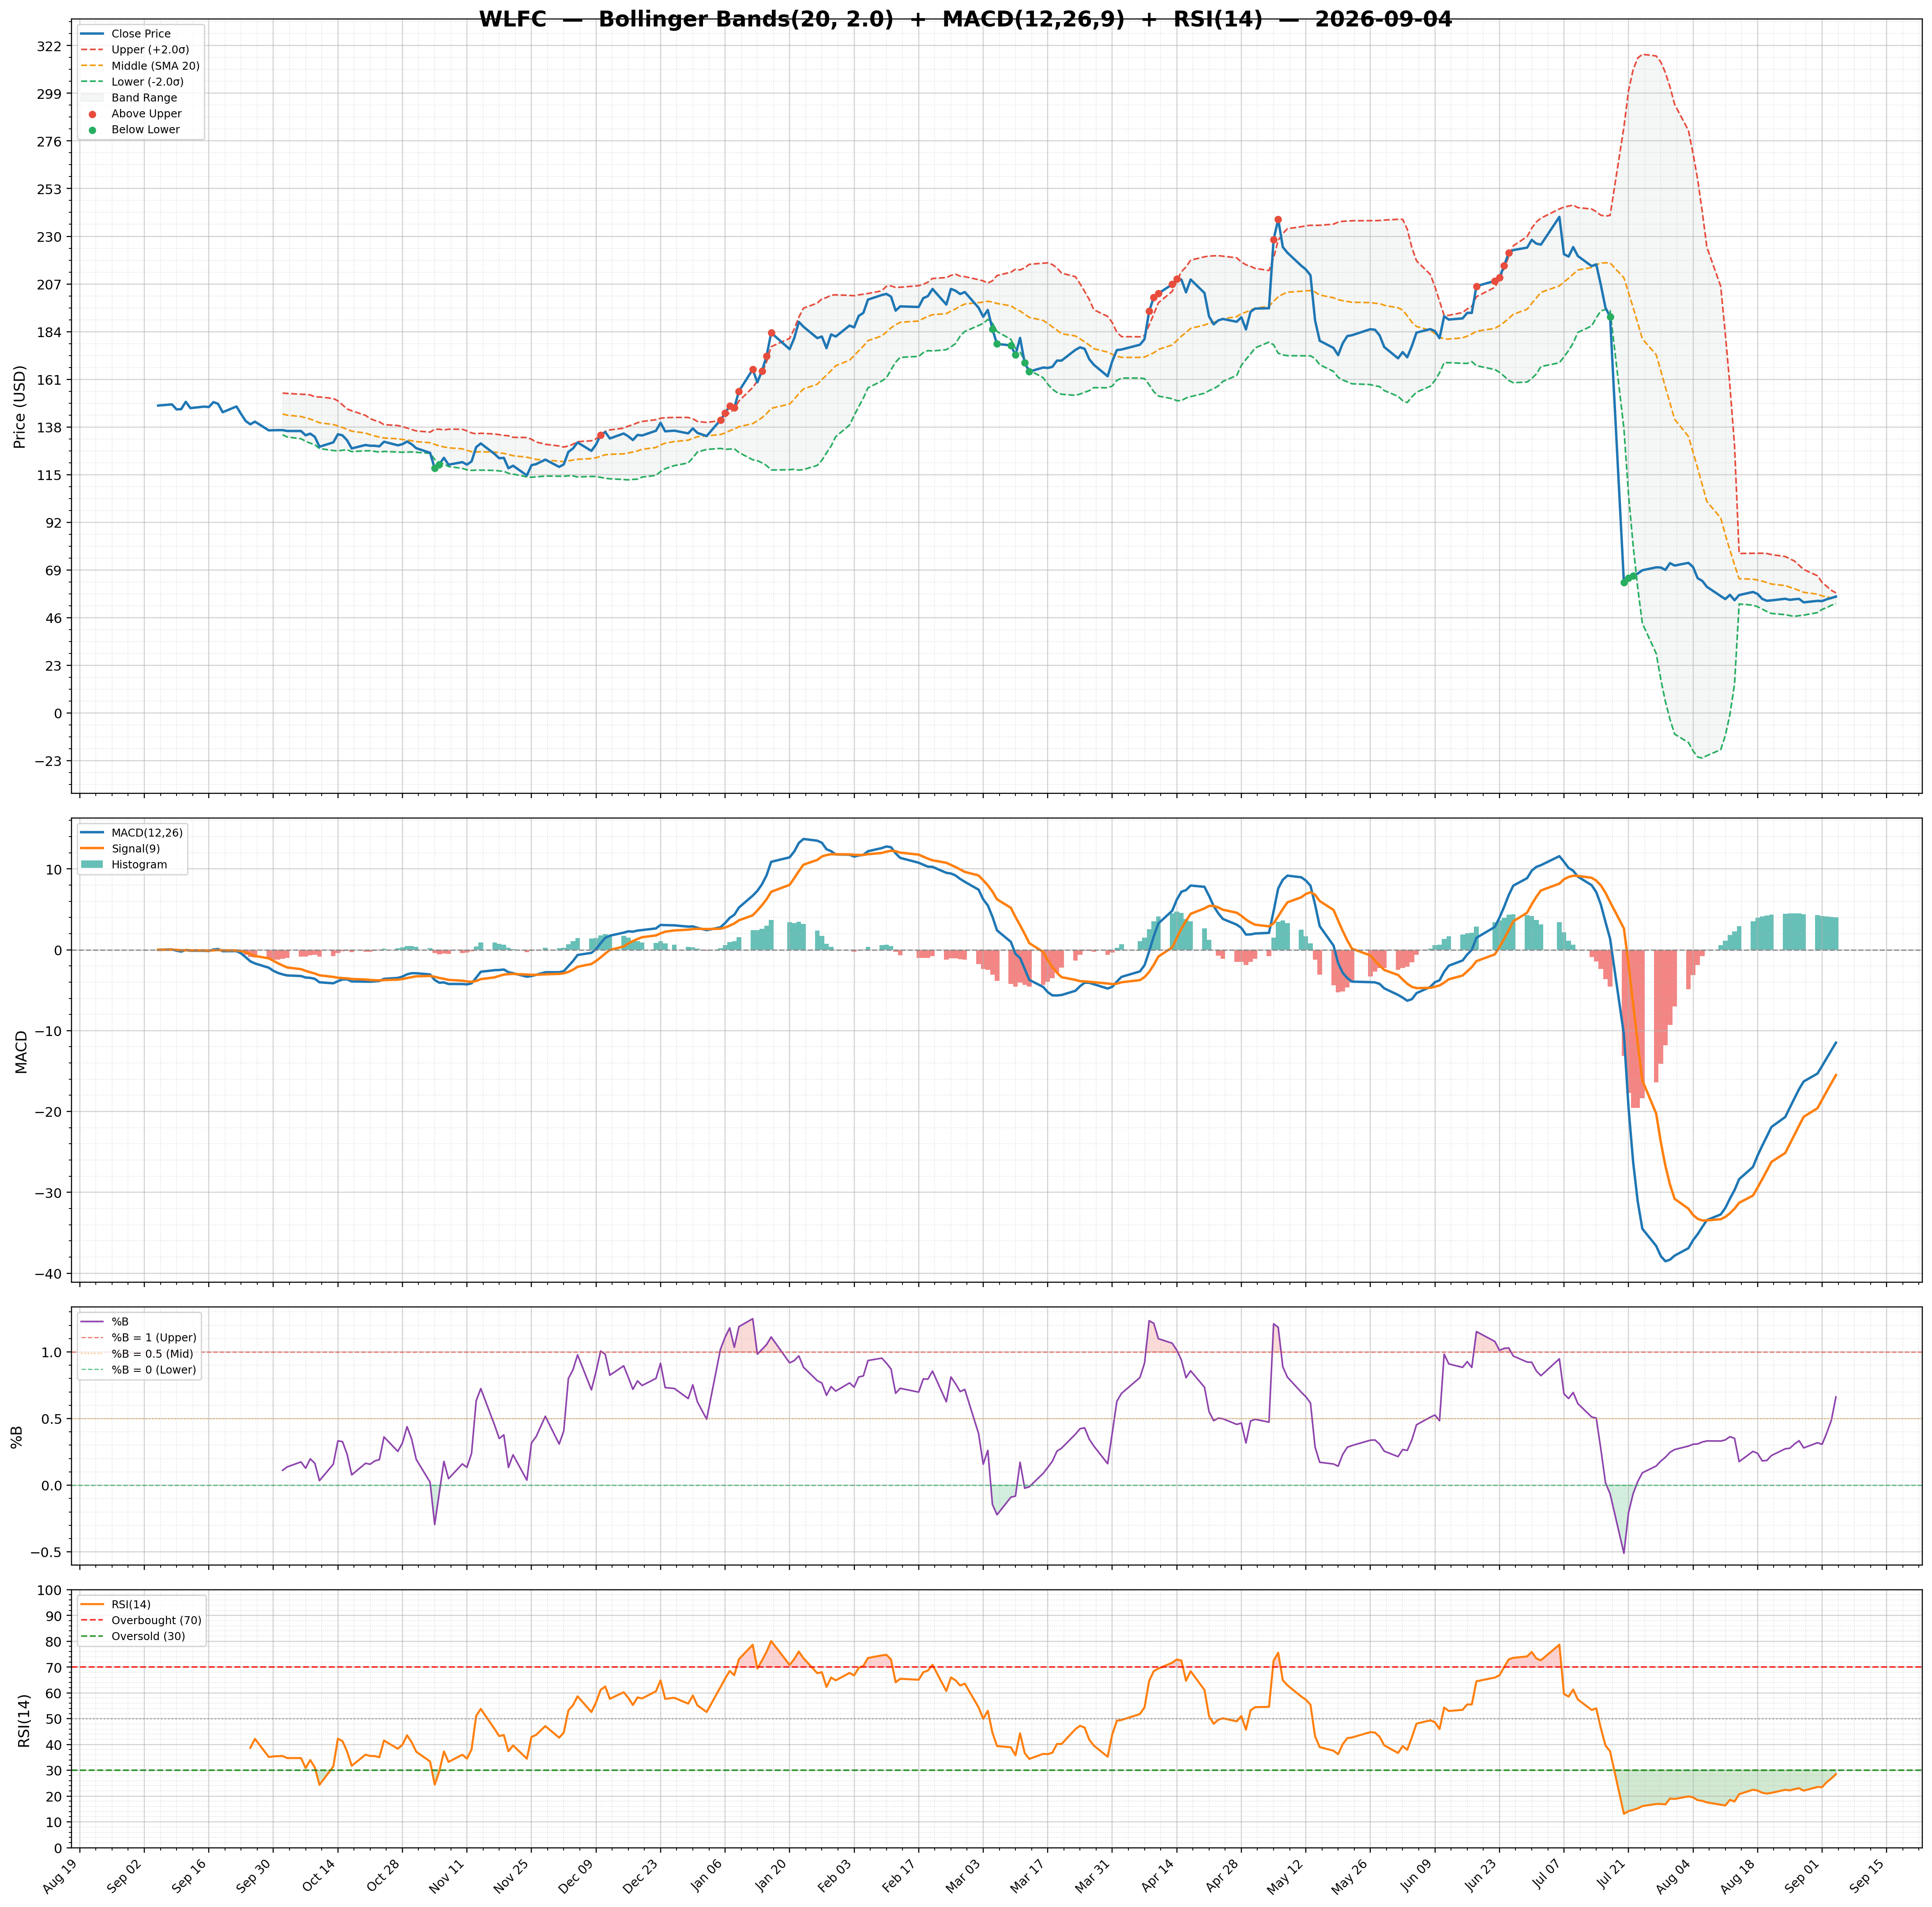
| RSI | 35.49 | Volume | 0.17M | Rating | none |
| Previous RSI | 30.02 | Avg Volume 20D | 0.25M | Target Mean | $75.50 |
| RSI Trend | Up | Relative Volume | 1.44 | Target High | $80.00 |
| MACD | -4.01 | Lower Band | 31.86 | Target Low | $71.00 |
| MACD Signal | -4.22 | Middle Band | 42.75 | Target Median | $75.50 |
| Histogram | 0.21 | Upper Band | 53.63 | Analysts | 2 |
| Previous Histogram | -0.08 | Bandwidth | 50.920 | Upside | 100.74% |
| Histogram Trend | Increasing | %B | 0.39 | ||