Wynn Resorts, Limited (WYNN)
Consumer Cyclical • Resorts & Casinos • $75.13 • MCap: 7,784,825,856
https://www.wynnresorts.com • Wynn Resorts, Limited designs, develops, and operates integrated resorts. It operates in four segments: Wynn Palace, Wynn Macau, Las Vegas Operations, and Encore Boston Harbor. The Wynn Palace segment operates casino space, private gaming salons, and sky casinos; a luxury hotel tower with suites and villas, as well as a health club, spa, salon, and pool; food and beverage outlets; retail space; meeting and convention space; and a performance lake, an immersive entertainment center, Western and Asian art displays, and a gondola ride. Its Wynn Macau segment operates casino space, private gaming salons, sky casinos, and a poker room; luxury hotel towers with health clubs, spas, a salon, and a pool; food and beverage outlets; retail space; meeting and convention space; a performance lake; and a rotunda show featuring Chinese zodiac-inspired ceilings. The Las Vegas Operations segment operates casino space, private gaming salons, a sky casino, a poker room, and a race and sports book; a luxury hotel tower with suites, villas, swimming pools, private cabanas, full-service spas and salons, and a wedding chapel; food and beverage outlets; meeting and convention space; retail space; a golf course; nightclubs; a beach club; and theaters. Its Encore Boston Harbor segment operates casino space, private and high-limit gaming areas, and a sports book; a luxury hotel tower with suites, a spa, and a salon; food and beverage outlets; a nightclub; retail space; meeting and convention space; a waterfront park; floral displays; and water shuttle services. Wynn Resorts, Limited was incorporated in 2002 and is based in Las Vegas, Nevada.
ET
| Score | Price | 52 Week & Averages | Relative Strength | Risk | |||||
|---|---|---|---|---|---|---|---|---|---|
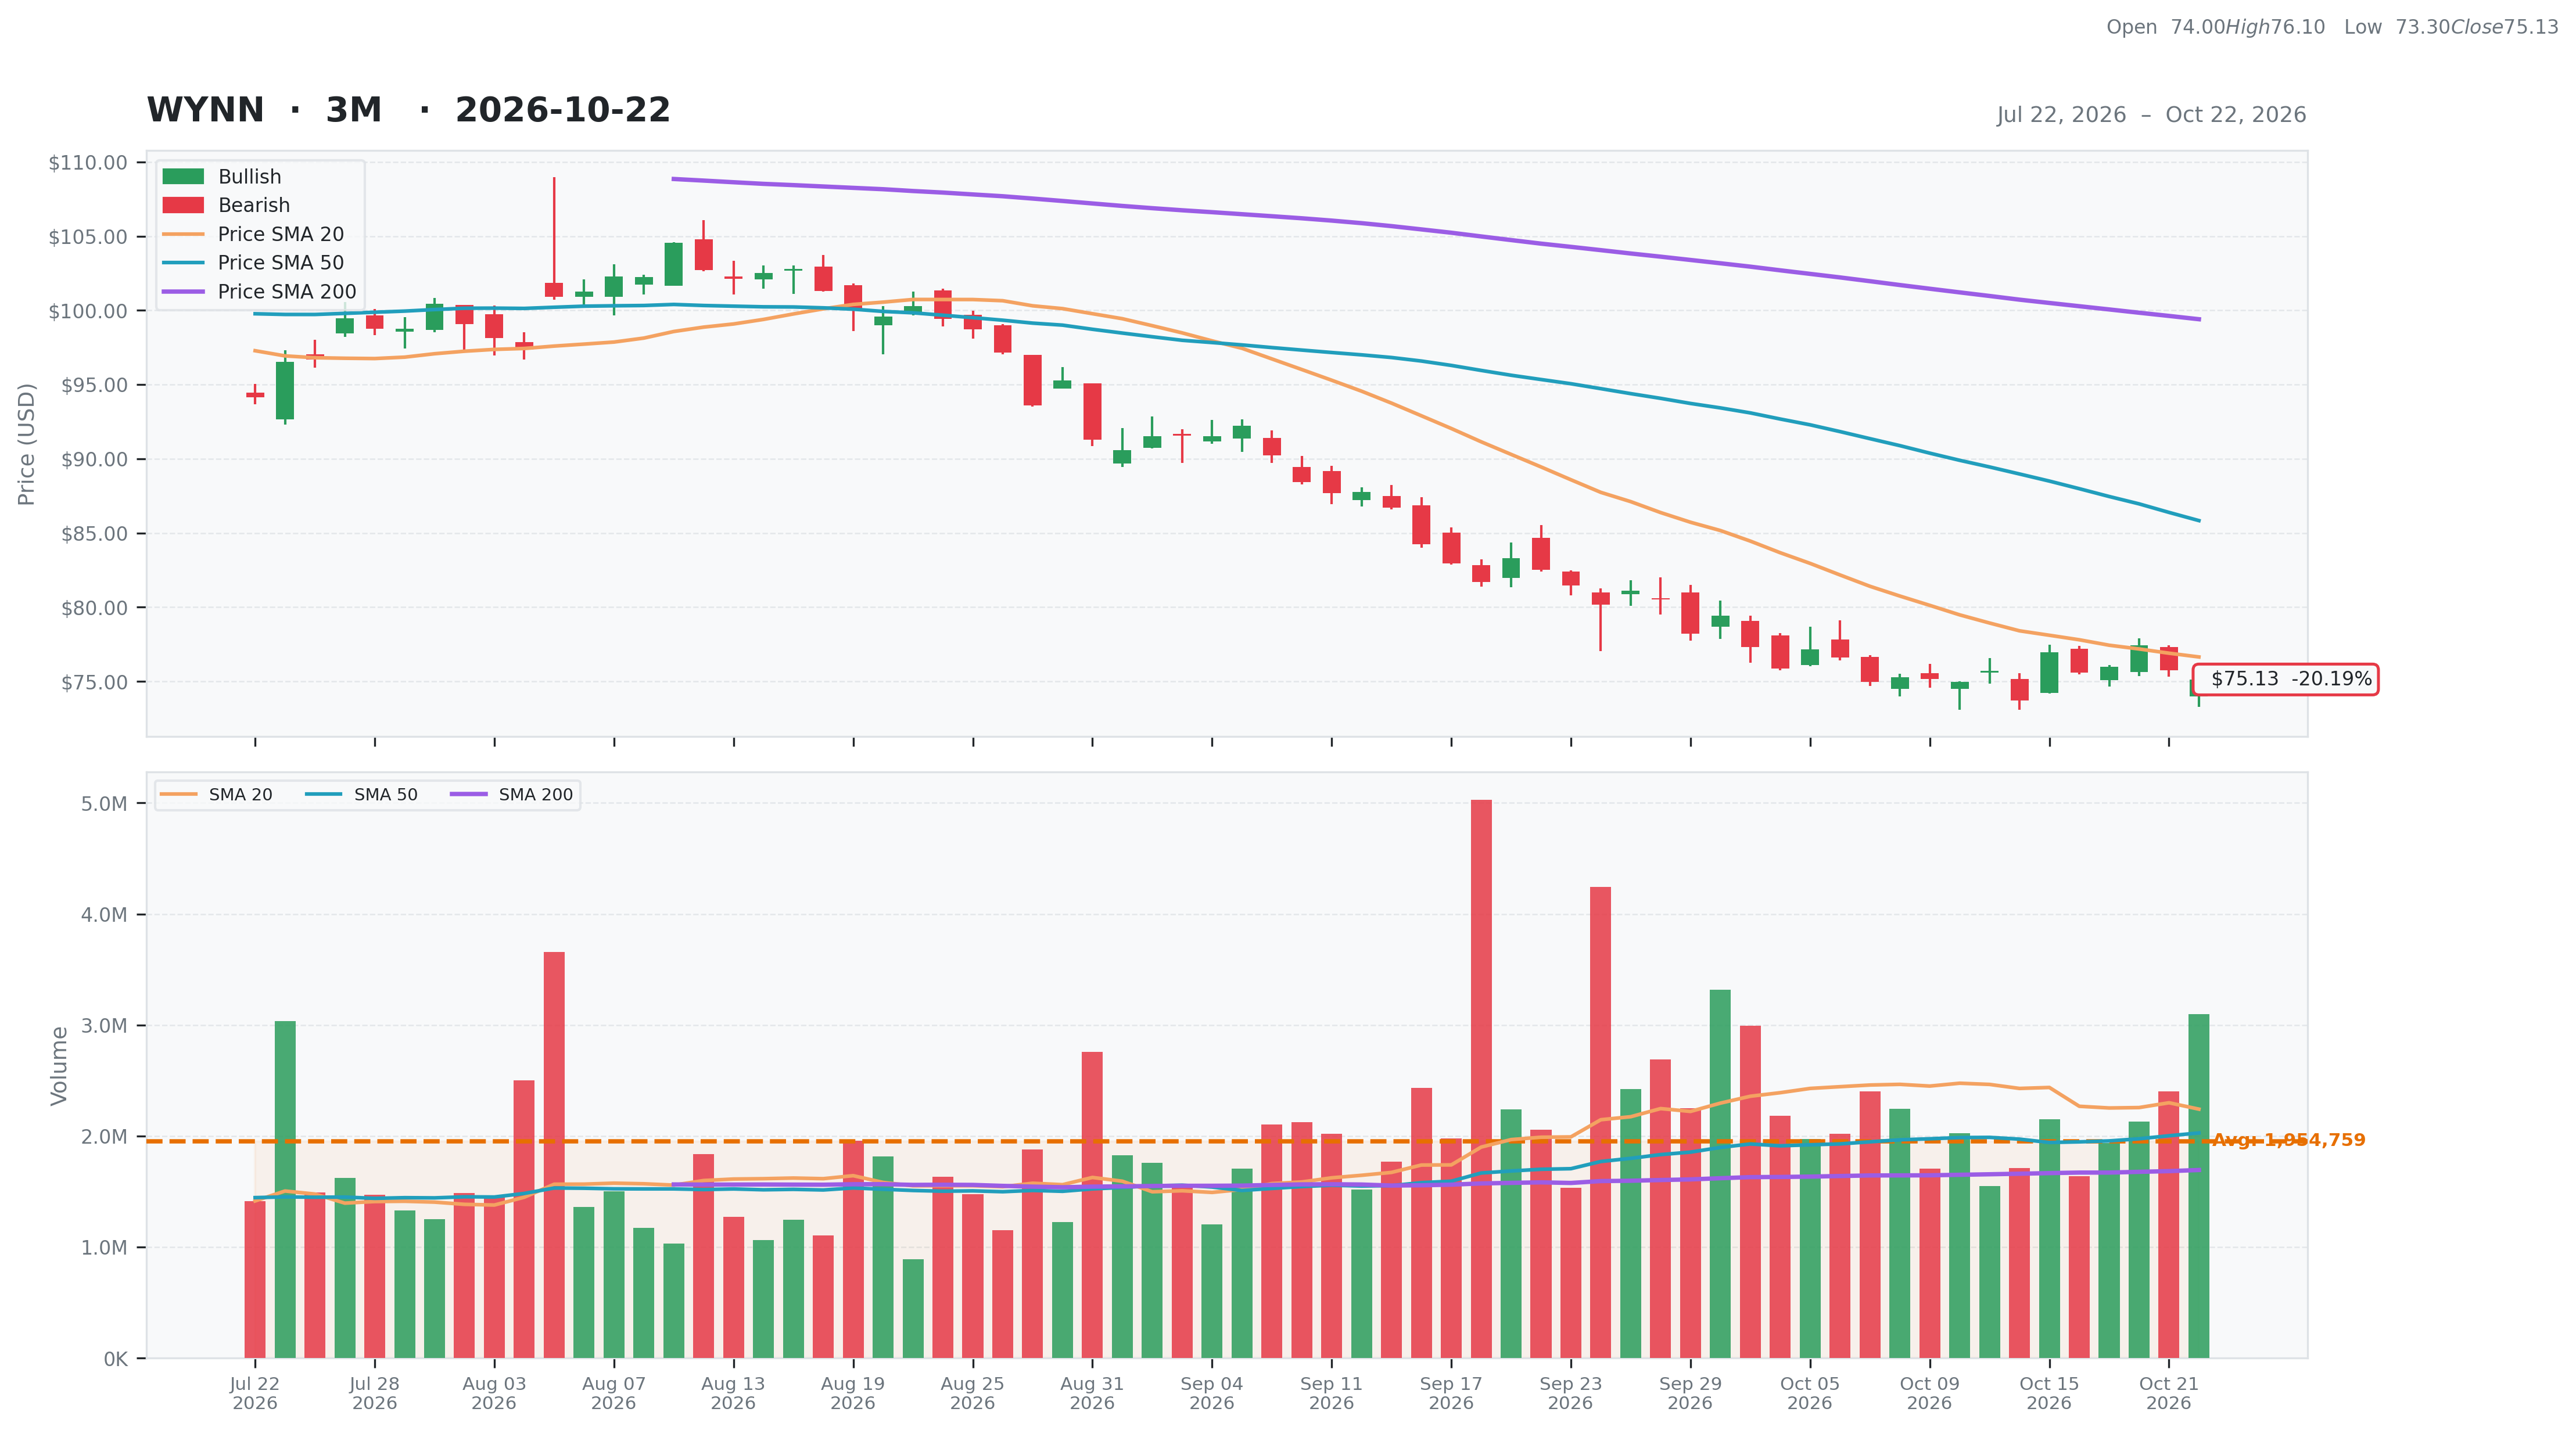
| Total | 70 | Current | $75.13 | 52W High | $132.13 -43.14% | Relative Strength | -0.29 | Beta | 0.95 |
| Business Quality | 17 | Weekly | $76.97 -2.39% | 52W Low | $73.73 1.90% | 3M | -0.22 | Short % | 0.11 |
| Financial Strength | 10 | Monthly | $82.51 -8.94% | Above 50DMA | $85.83 -12.47% | 6M | -0.28 | Risk Score | 8 |
| Growth Outlook | 15 | Quarterly | $96.68 -22.29% | Above 200DMA | $99.40 -24.42% | 9M | -0.34 | ||
| Momentum | 3 | Yearly | $124.28 -39.55% | 12M | -0.40 | ||||
| Valuation | Financial Strength | Growth/Profitability | |||
|---|---|---|---|---|---|
| Trailing P/E | 18.13 | Cash | 2,101M | Revenue Growth | 0.07% |
| Forward P/E | 15.17 | Debt | 12,342M | Earnings Growth | 1.06% |
| PEG Ratio | 0.68 | Debt/Equity | N/A | Qtr Earnings Growth | 1.12% |
| Price/Sales | 1.05 | Current Ratio | 0.91 | Gross Margin | 0.68% |
| Price/Book | -45.46 | Quick Ratio | 0.84 | Operating Margin | 0.17% |
| EV/Revenue | 2.32 | Operating CF | 1,459M | Profit Margin | 0.06% |
| EV/EBITDA | 9.49 | Free CF | 476M | EBITDA Margin | 0.24% |
| Ent Value | 17,175M | Return on Assets | 0.06% | ||
| Return on Equity | N/A | ||||
| Technical | Volume & Bollinger Bands | Analyst | |||
|---|---|---|---|---|---|
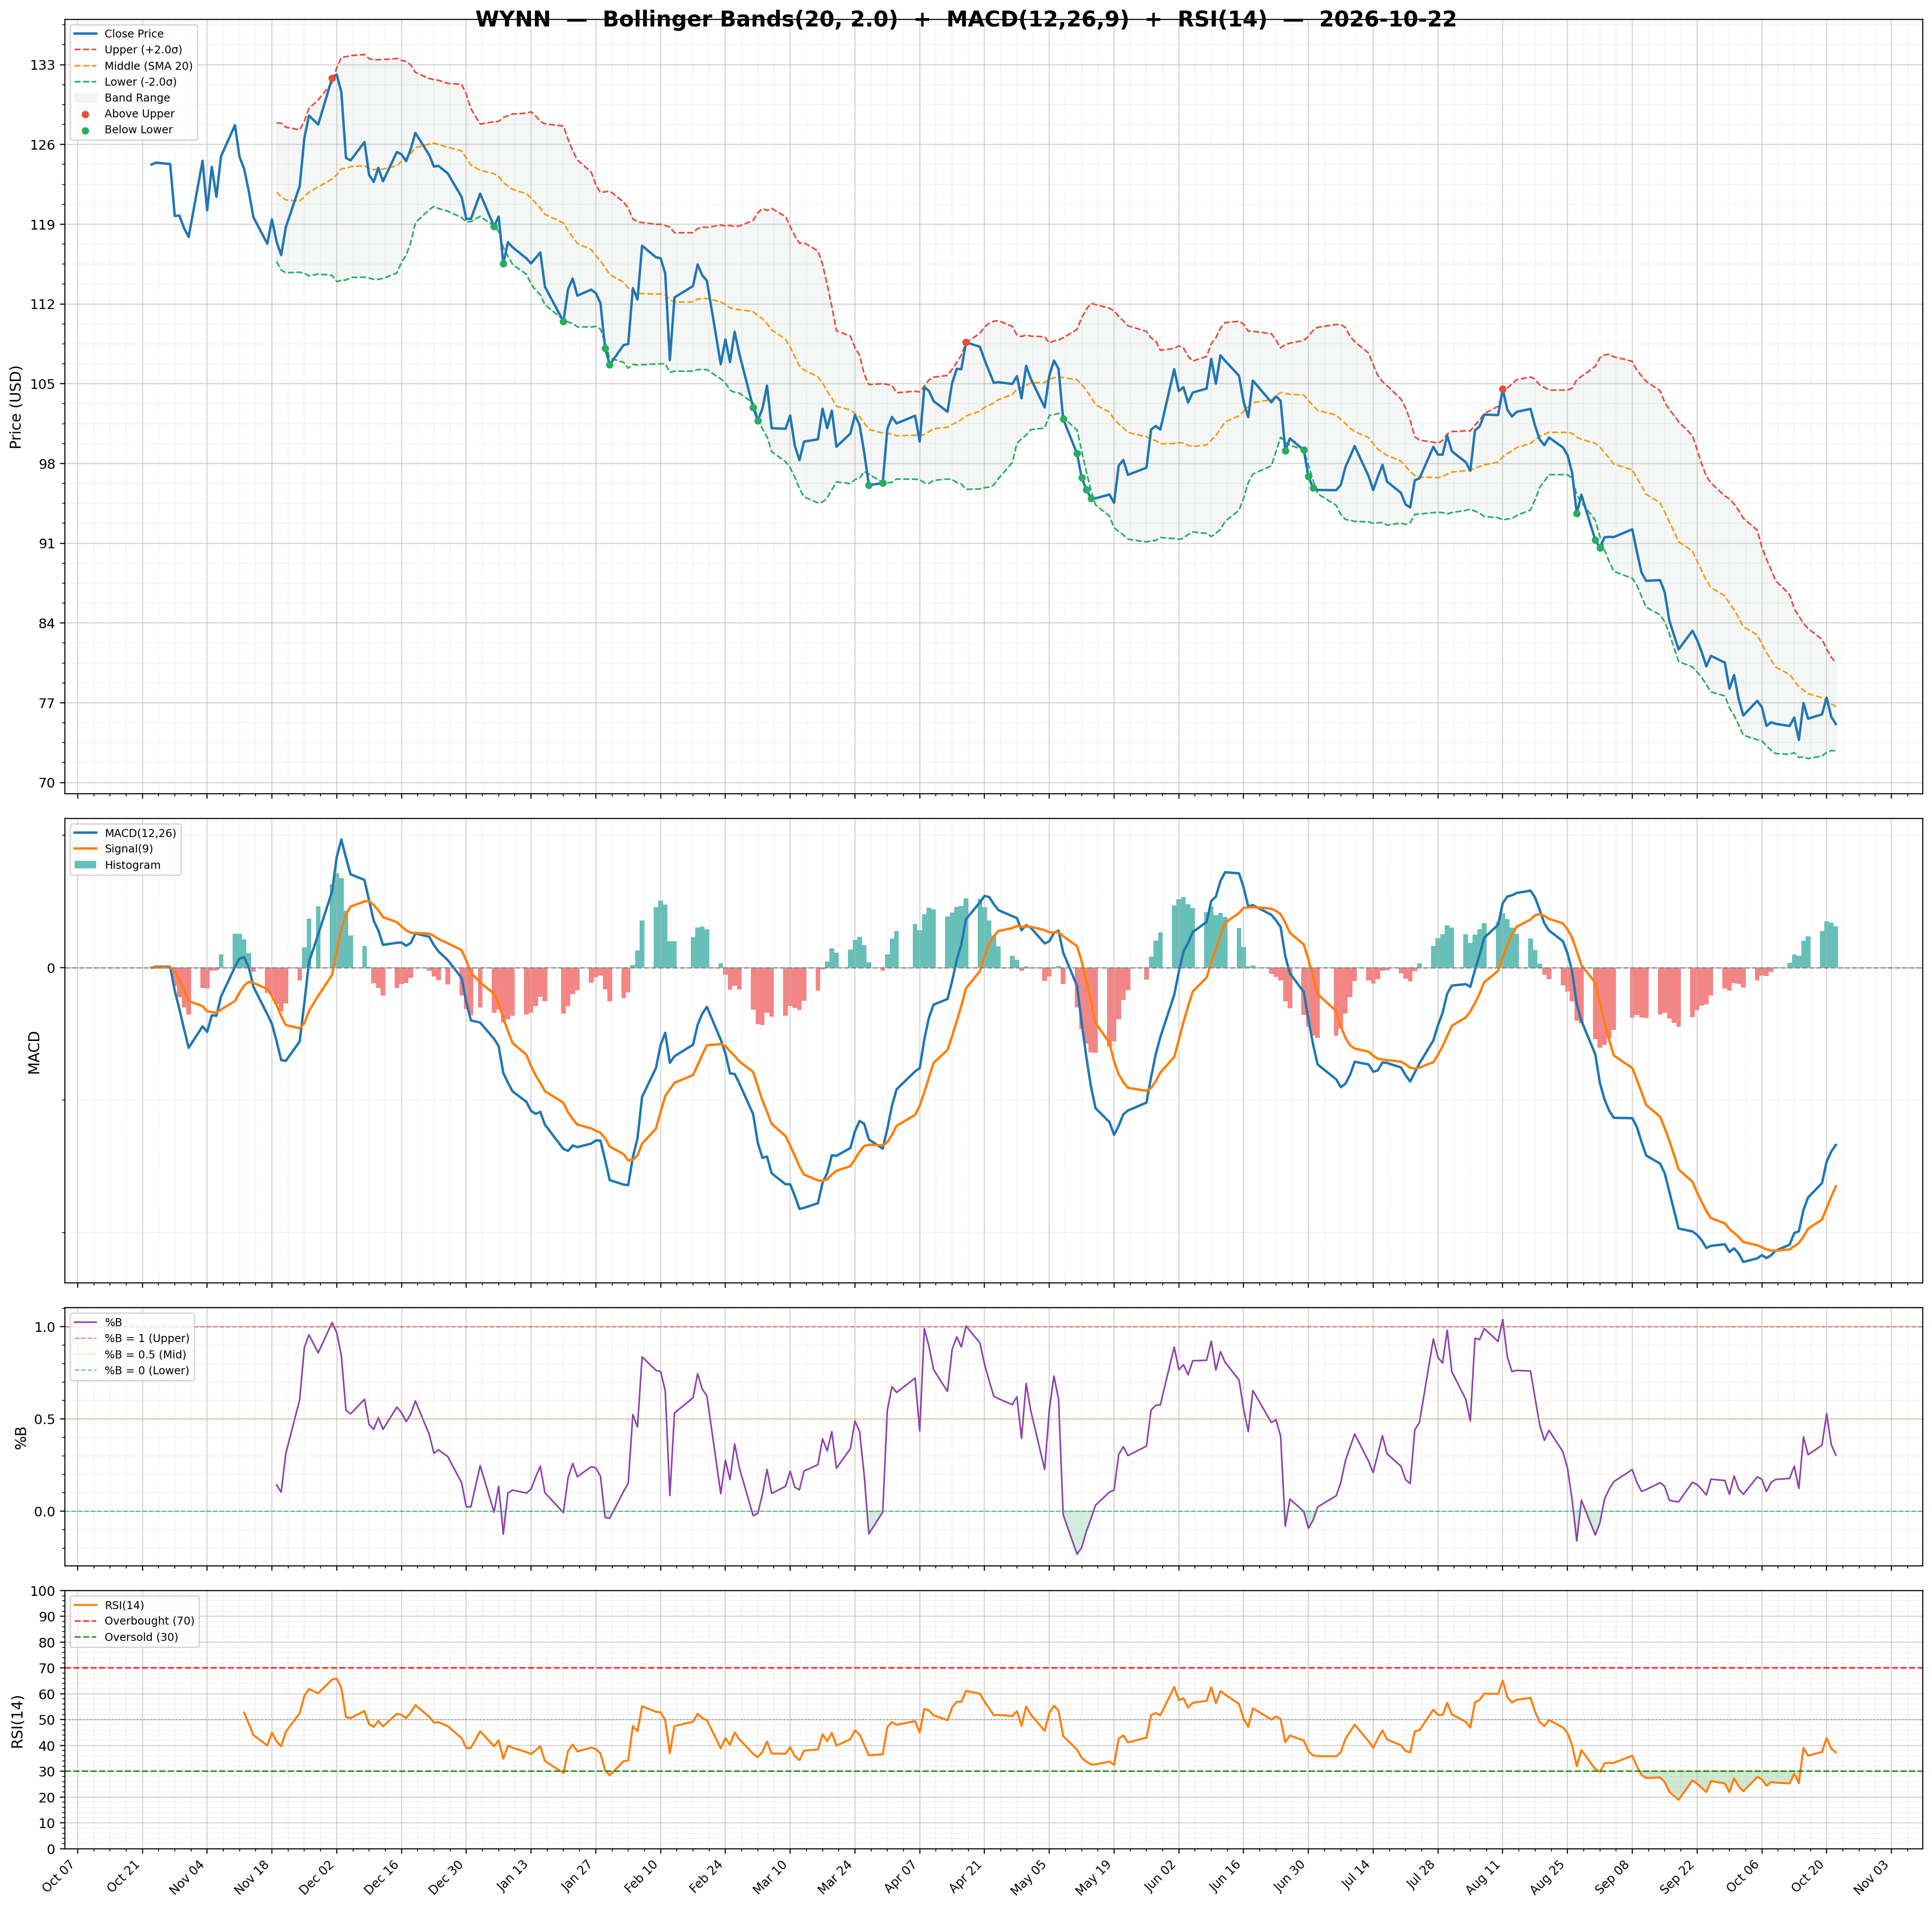
| RSI | 37.29 | Volume | 1.64M | Rating | strong_buy |
| Previous RSI | 38.72 | Avg Volume 20D | 2.24M | Target Mean | $127.20 |
| RSI Trend | Down | Relative Volume | 1.33 | Target High | $143.00 |
| MACD | -2.68 | Lower Band | 72.78 | Target Low | $102.00 |
| MACD Signal | -3.30 | Middle Band | 76.65 | Target Median | $128.50 |
| Histogram | 0.63 | Upper Band | 80.52 | Analysts | 20 |
| Previous Histogram | 0.68 | Bandwidth | 10.090 | Upside | 68.26% |
| Histogram Trend | Decreasing | %B | 0.30 | ||