State Street SPDR S&P Biotech E (XBI)
• • $151.64 • MCap:
• In seeking to track the performance of the S&P Biotechnology Select Industry Index (the "index"), the fund employs a sampling strategy. It generally invests substantially all, but at least 80%, of its total assets in the securities comprising the index. The index represents the biotechnology segment of the S&P Total Market Index ("S&P TMI").
Sector
| Score | Price | 52 Week & Averages | Relative Strength | Risk | |||||
|---|---|---|---|---|---|---|---|---|---|
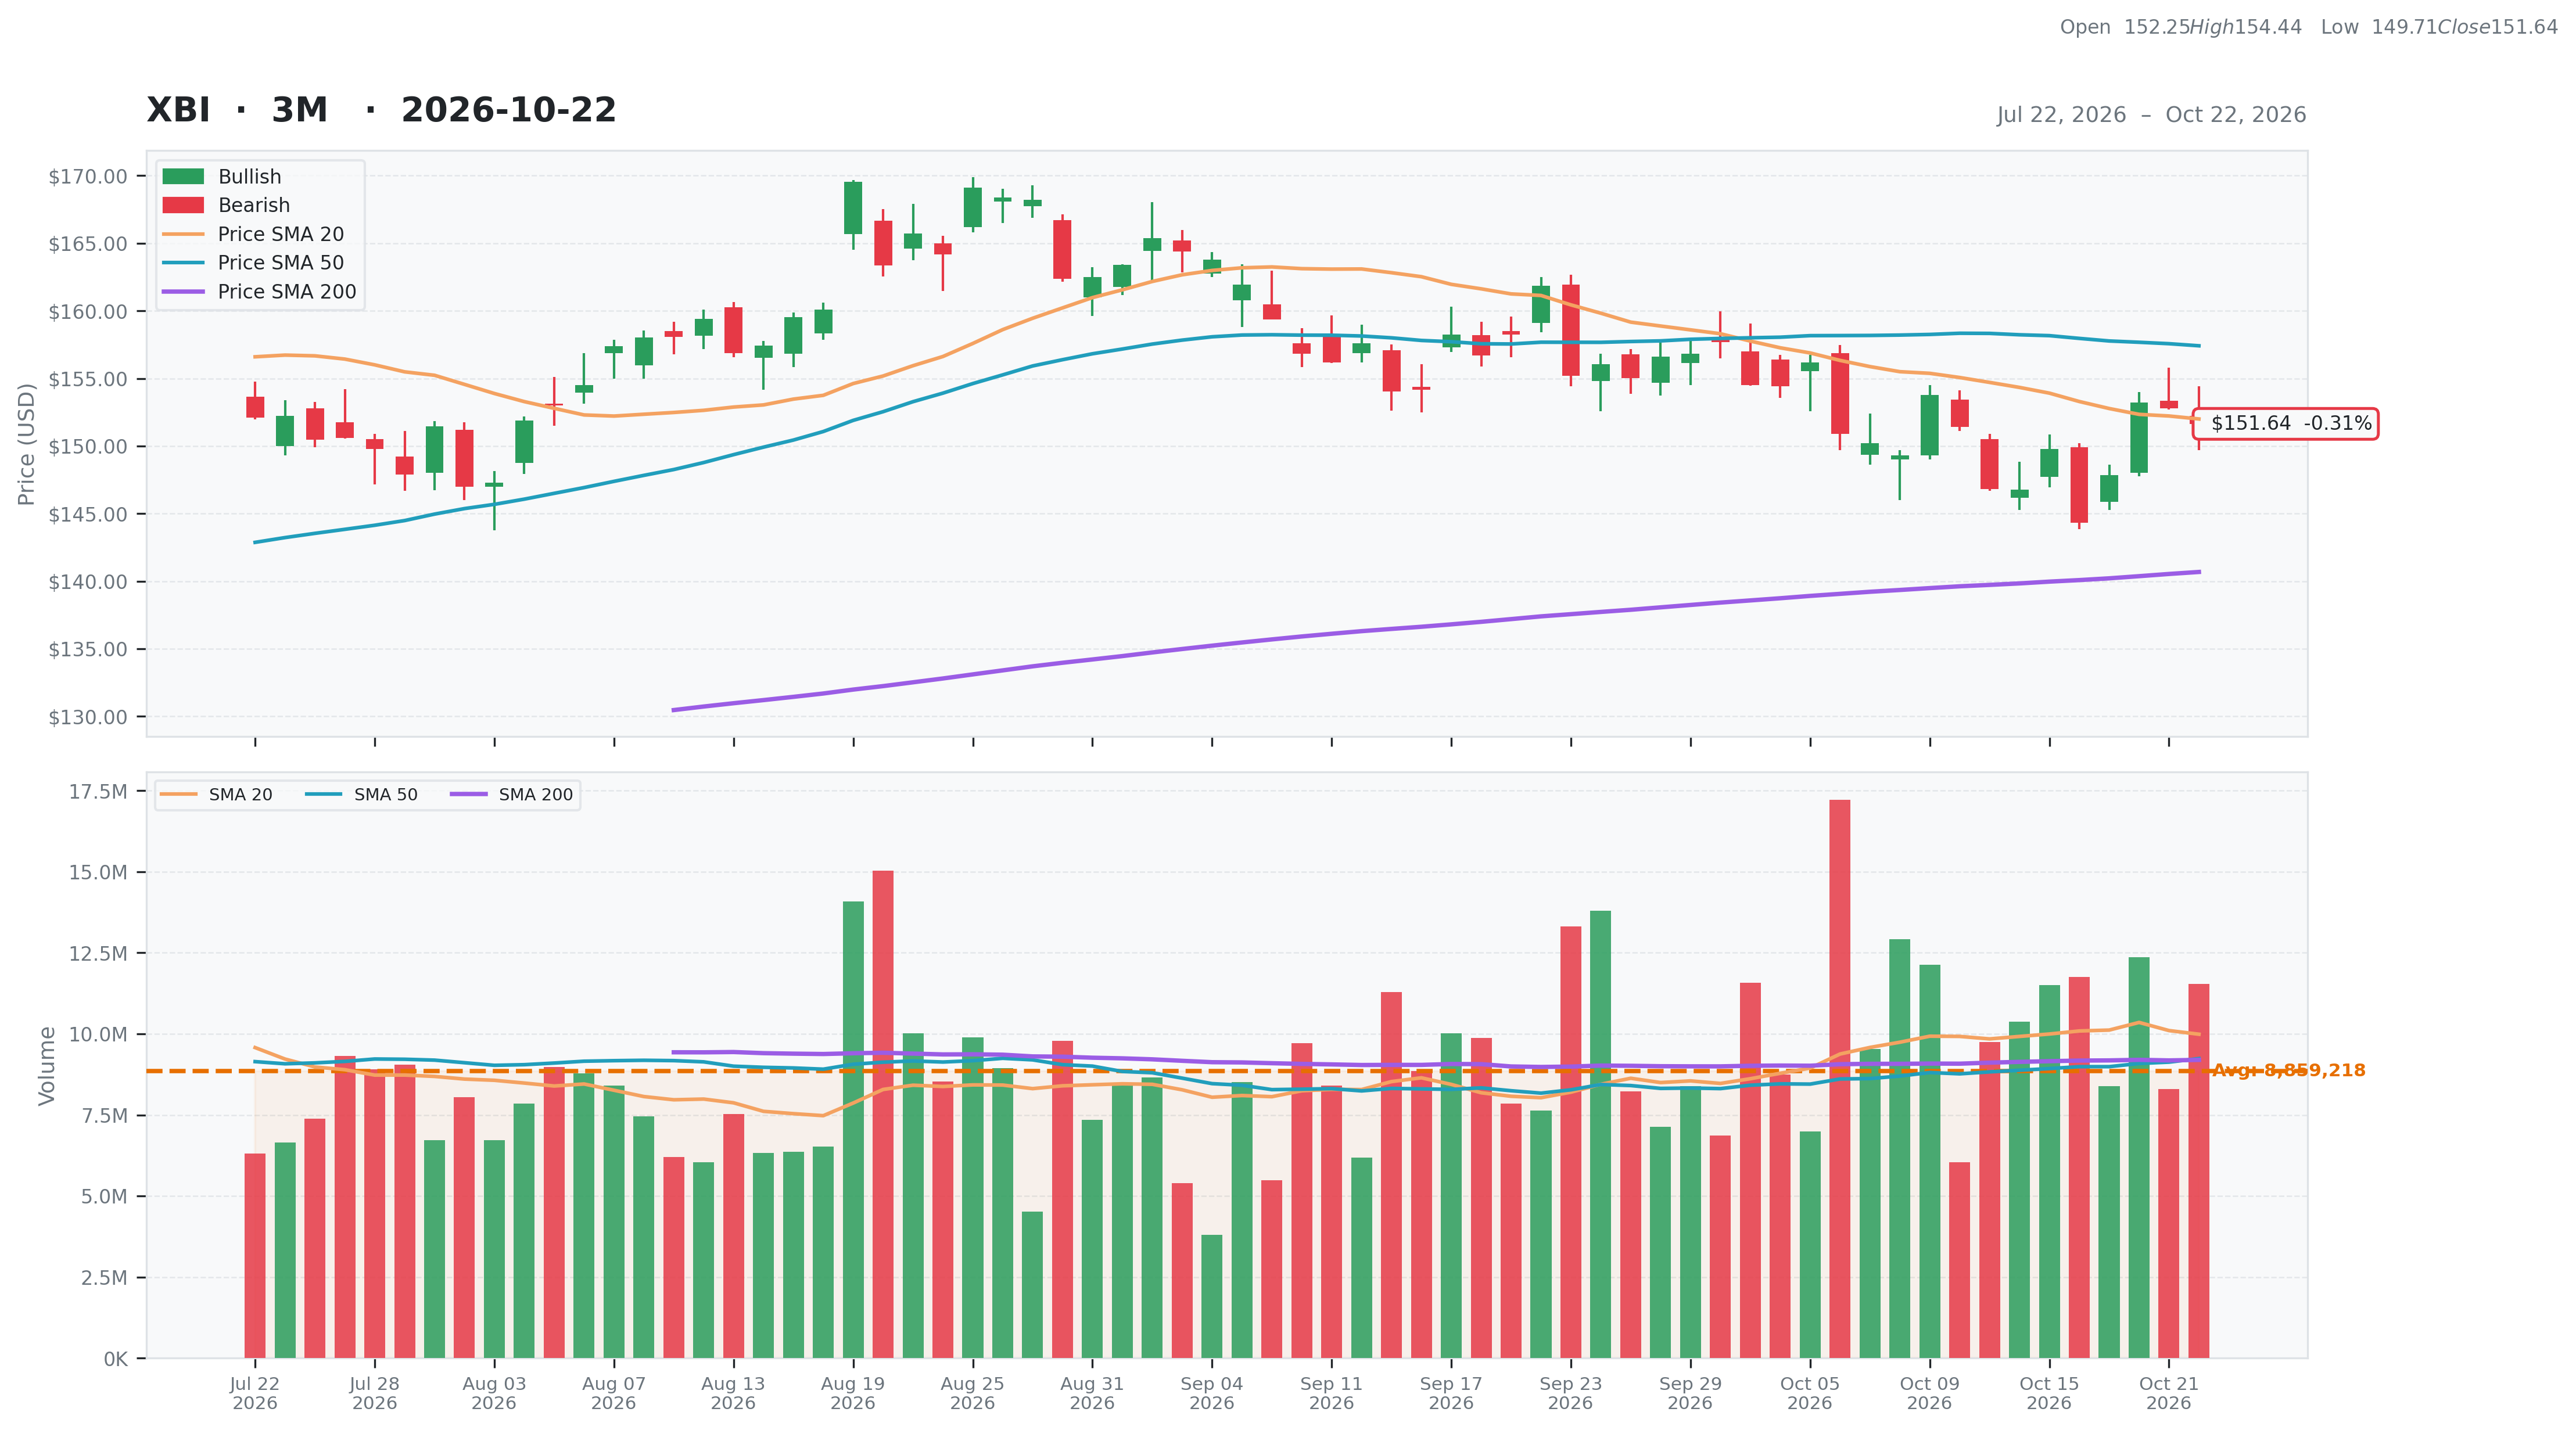
| Total | 28 | Current | $151.64 | 52W High | $169.55 -10.56% | Relative Strength | 0.14 | Beta | N/A |
| Business Quality | 1 | Weekly | $149.78 1.24% | 52W Low | $107.10 41.59% | 3M | 0.01 | Short % | |
| Financial Strength | 6 | Monthly | $161.87 -6.32% | Above 50DMA | $157.42 -3.67% | 6M | 0.13 | Risk Score | |
| Growth Outlook | 1 | Quarterly | $150.48 0.77% | Above 200DMA | $140.69 7.79% | 9M | 0.15 | ||
| Momentum | 2 | Yearly | $111.11 36.47% | 12M | 0.41 | ||||
| Valuation | Financial Strength | Growth/Profitability | |||
|---|---|---|---|---|---|
| Trailing P/E | N/A | Cash | N/A | Revenue Growth | N/A |
| Forward P/E | N/A | Debt | N/A | Earnings Growth | N/A |
| PEG Ratio | N/A | Debt/Equity | N/A | Qtr Earnings Growth | N/A |
| Price/Sales | N/A | Current Ratio | N/A | Gross Margin | N/A |
| Price/Book | N/A | Quick Ratio | N/A | Operating Margin | N/A |
| EV/Revenue | N/A | Operating CF | N/A | Profit Margin | N/A |
| EV/EBITDA | N/A | Free CF | N/A | EBITDA Margin | N/A |
| Ent Value | N/A | Return on Assets | N/A | ||
| Return on Equity | N/A | ||||
| Technical | Volume & Bollinger Bands | Analyst | |||
|---|---|---|---|---|---|
| RSI | 48.09 | Volume | 11.75M | Rating | |
| Previous RSI | 49.73 | Avg Volume 20D | 9.99M | Target Mean | N/A |
| RSI Trend | Down | Relative Volume | 1.17 | Target High | N/A |
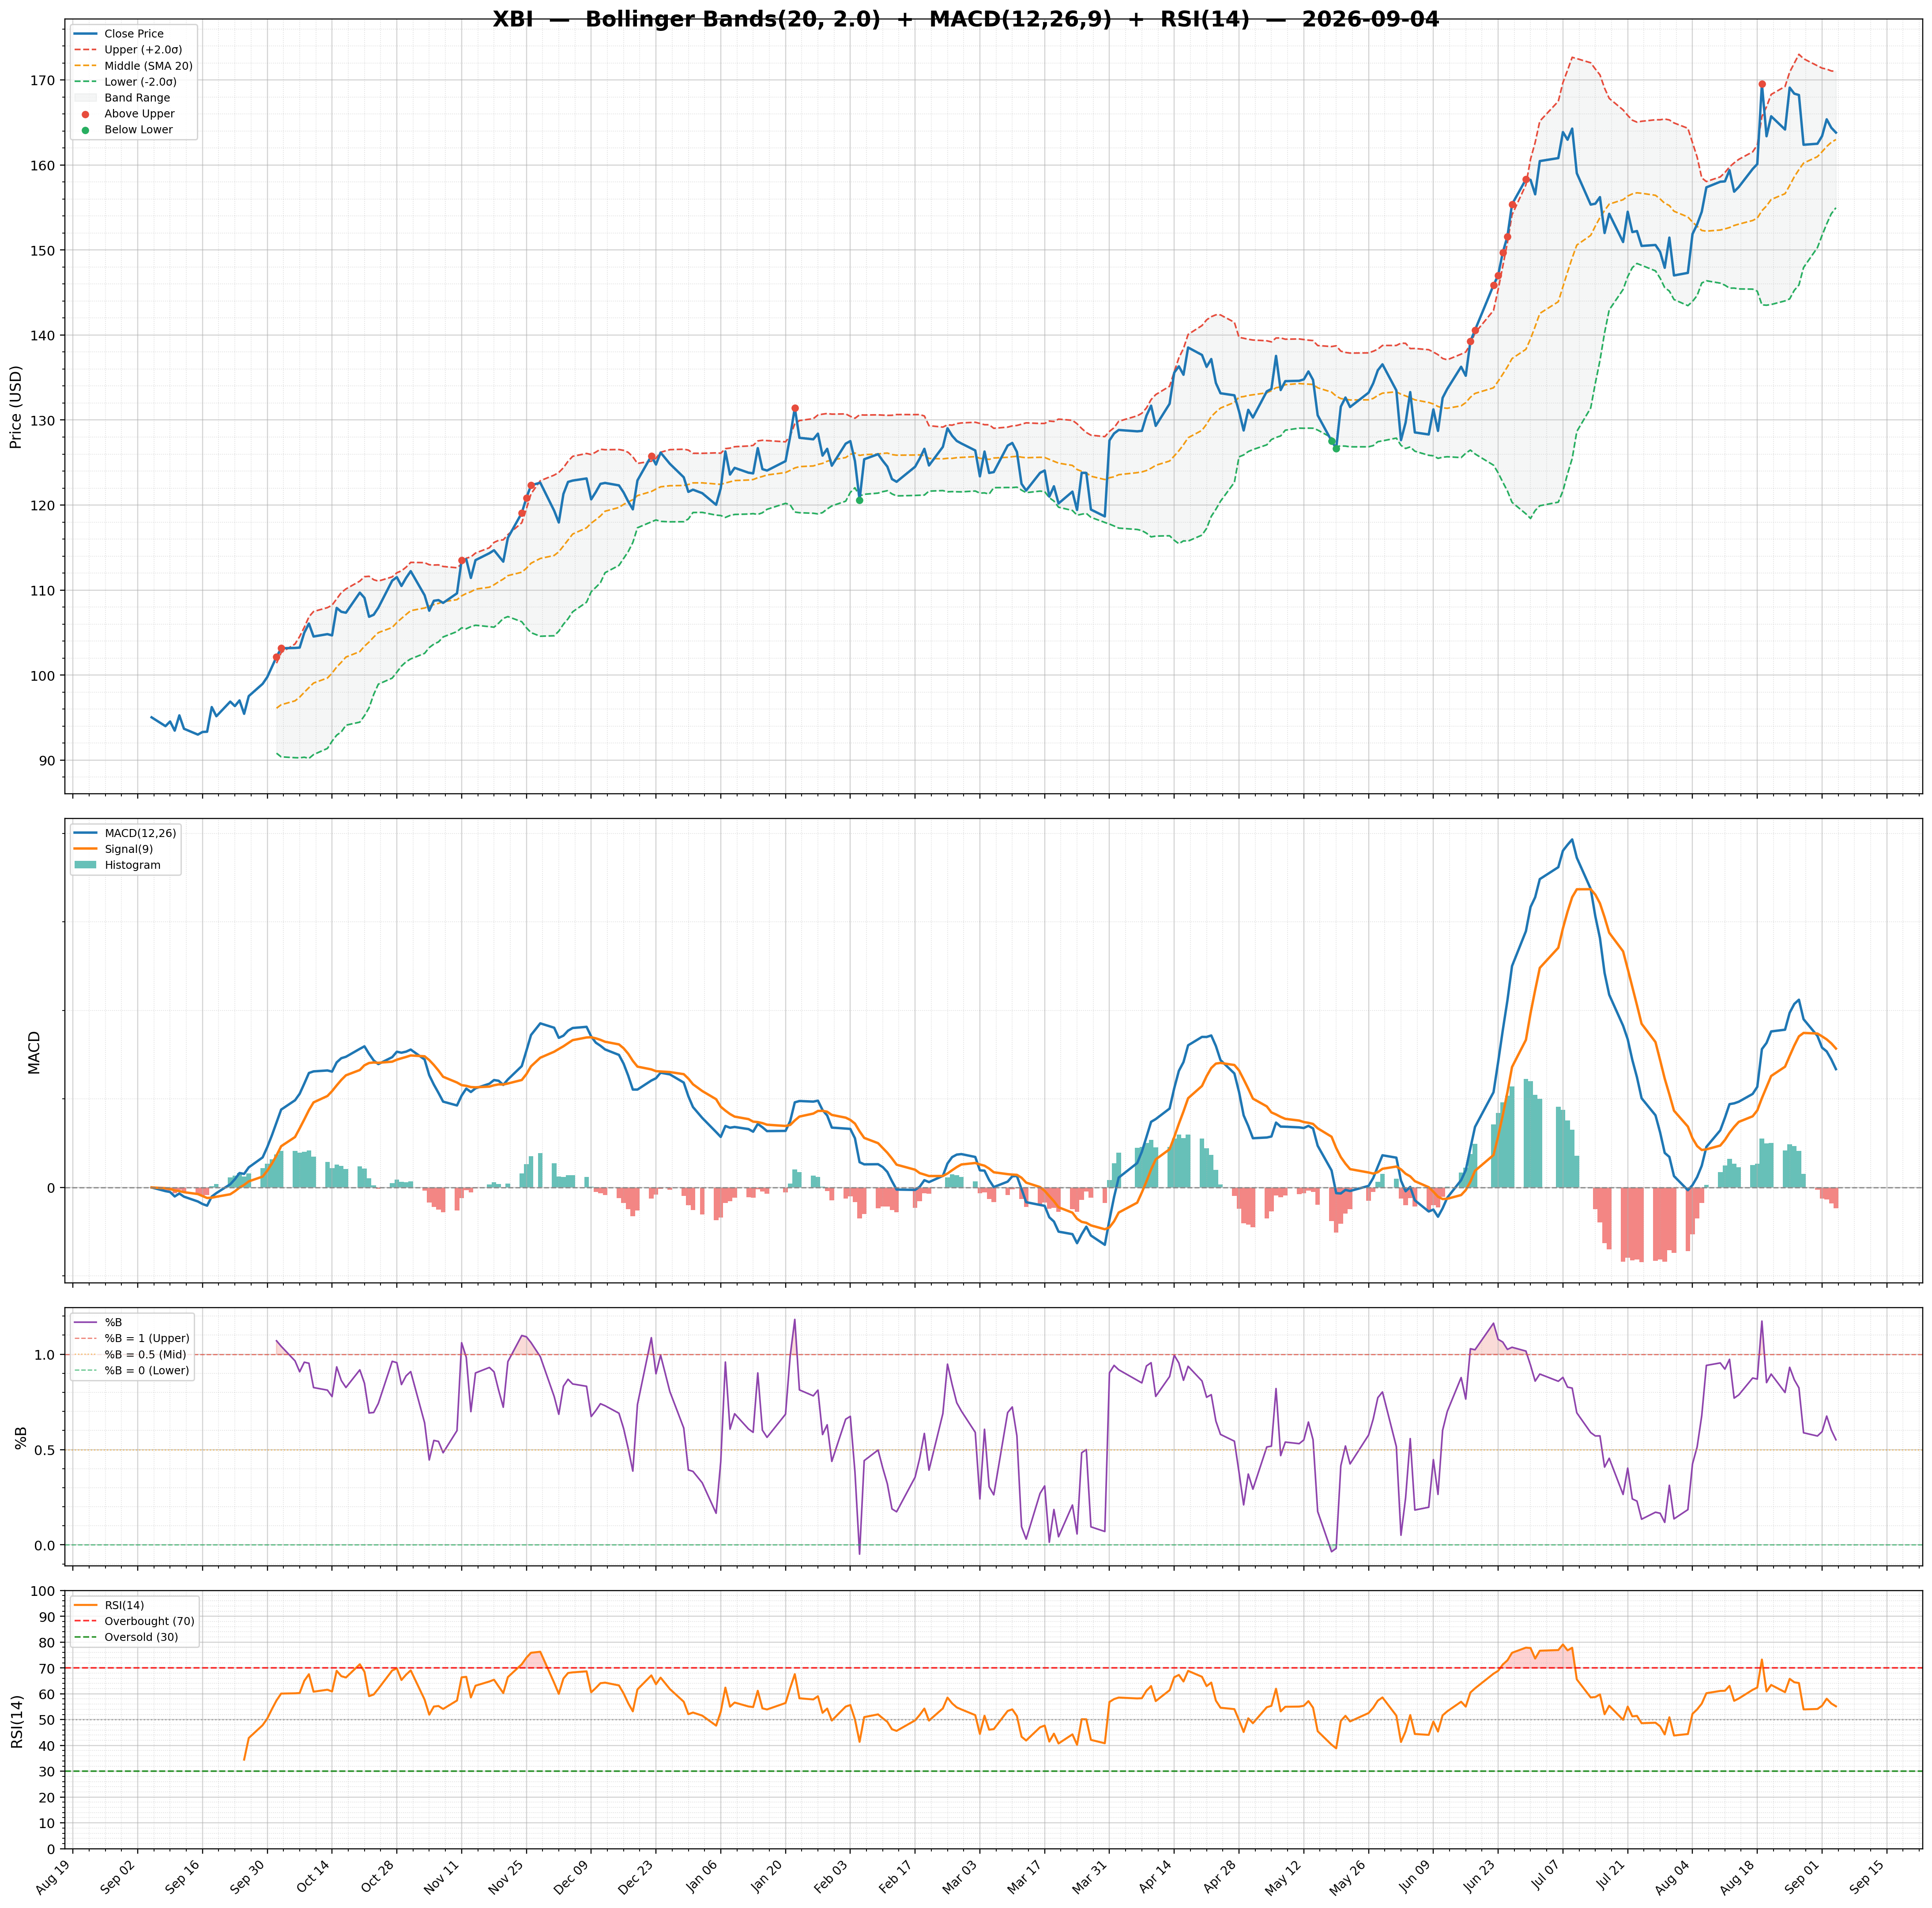
| MACD | -1.86 | Lower Band | 144.48 | Target Low | N/A |
| MACD Signal | -2.23 | Middle Band | 152.00 | Target Median | N/A |
| Histogram | 0.37 | Upper Band | 159.52 | Analysts | N/A |
| Previous Histogram | 0.24 | Bandwidth | 9.890 | Upside | N/A |
| Histogram Trend | Increasing | %B | 0.48 | ||