State Street Technology Select (XLK)
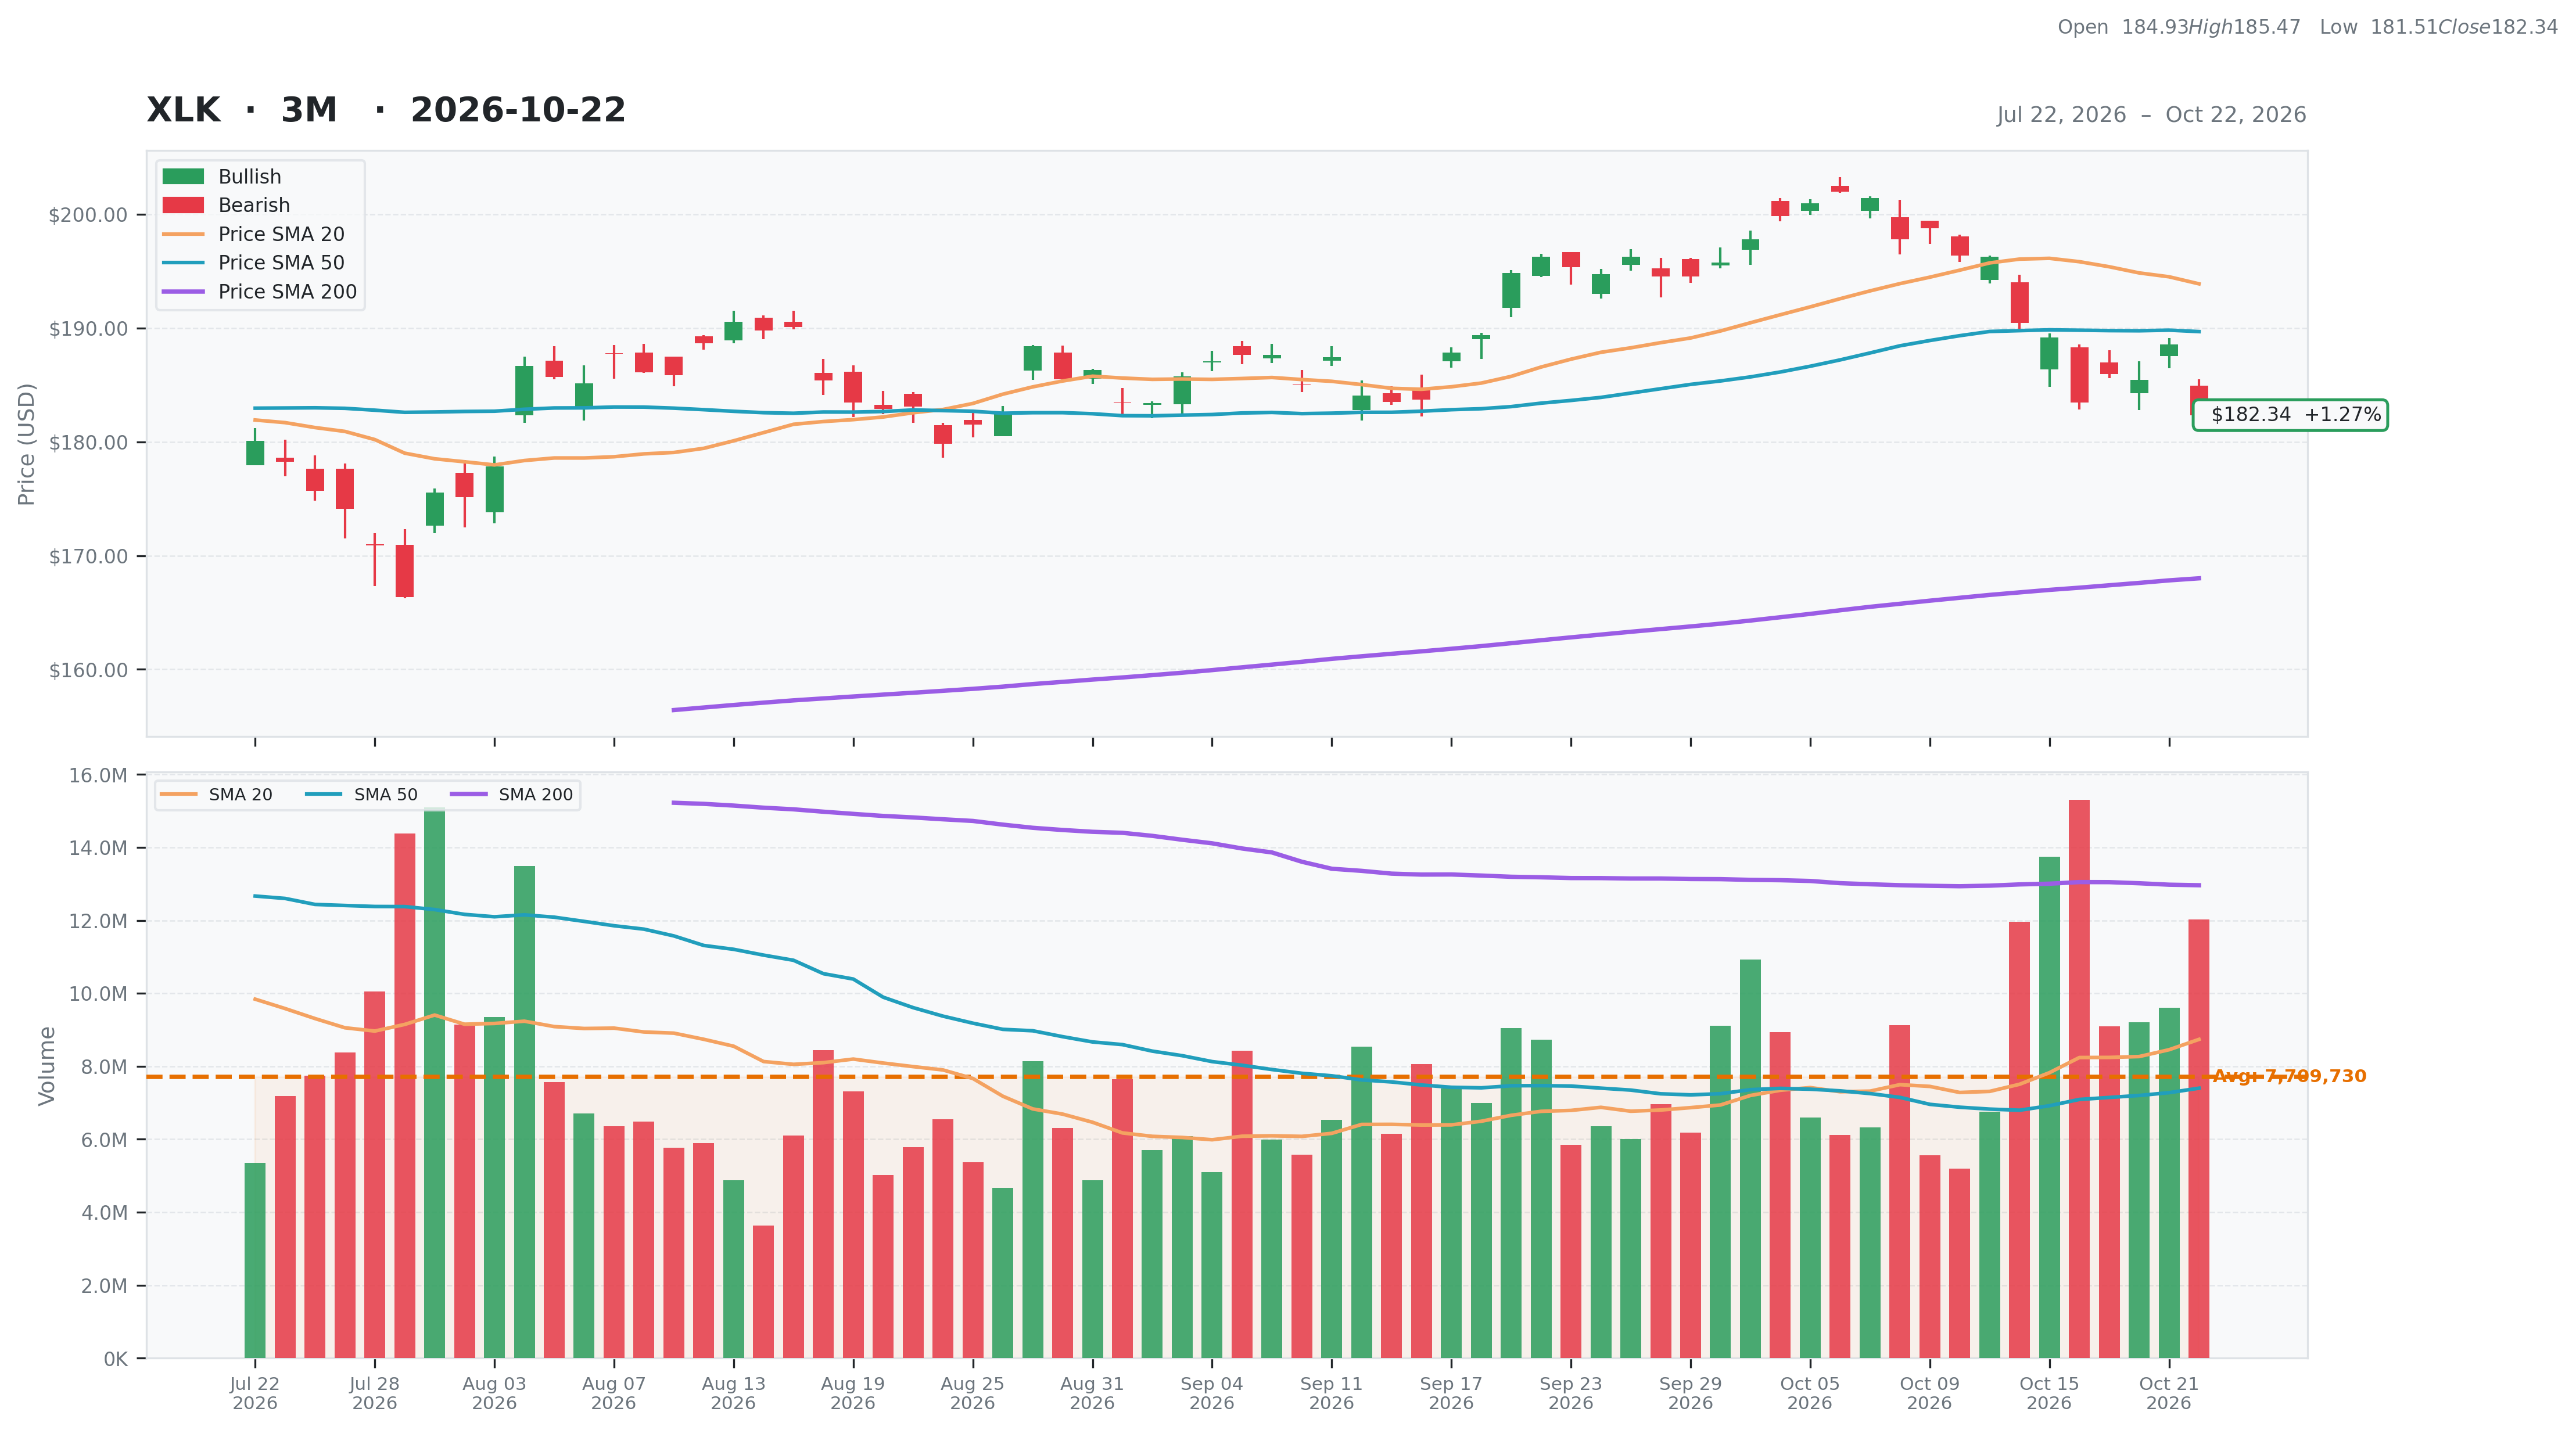
• • $182.34 • MCap:
• In seeking to track the performance of the index, the fund employs a replication strategy, which means that the fund typically invests in substantially all of the securities represented in the index in approximately the same proportions as the index. It generally invests substantially all, but at least 95%, of its total assets in the securities comprising the index. The fund is non-diversified.
Sector
| Score | Price | 52 Week & Averages | Relative Strength | Risk | |||||
|---|---|---|---|---|---|---|---|---|---|
| Total | 28 | Current | $182.34 | 52W High | $202.00 -9.73% | Relative Strength | 0.15 | Beta | N/A |
| Business Quality | 1 | Weekly | $189.19 -3.62% | 52W Low | $127.20 43.35% | 3M | 0.04 | Short % | |
| Financial Strength | 6 | Monthly | $196.27 -7.10% | Above 50DMA | $189.68 -3.87% | 6M | 0.17 | Risk Score | |
| Growth Outlook | 1 | Quarterly | $175.67 3.79% | Above 200DMA | $168.00 8.53% | 9M | 0.26 | ||
| Momentum | 2 | Yearly | $148.74 22.59% | 12M | 0.25 | ||||
| Valuation | Financial Strength | Growth/Profitability | |||
|---|---|---|---|---|---|
| Trailing P/E | 30.04 | Cash | N/A | Revenue Growth | N/A |
| Forward P/E | N/A | Debt | N/A | Earnings Growth | N/A |
| PEG Ratio | N/A | Debt/Equity | N/A | Qtr Earnings Growth | N/A |
| Price/Sales | N/A | Current Ratio | N/A | Gross Margin | N/A |
| Price/Book | N/A | Quick Ratio | N/A | Operating Margin | N/A |
| EV/Revenue | N/A | Operating CF | N/A | Profit Margin | N/A |
| EV/EBITDA | N/A | Free CF | N/A | EBITDA Margin | N/A |
| Ent Value | N/A | Return on Assets | N/A | ||
| Return on Equity | N/A | ||||
| Technical | Volume & Bollinger Bands | Analyst | |||
|---|---|---|---|---|---|
| RSI | 36.44 | Volume | 15.29M | Rating | |
| Previous RSI | 44.54 | Avg Volume 20D | 8.74M | Target Mean | N/A |
| RSI Trend | Down | Relative Volume | 1.45 | Target High | N/A |
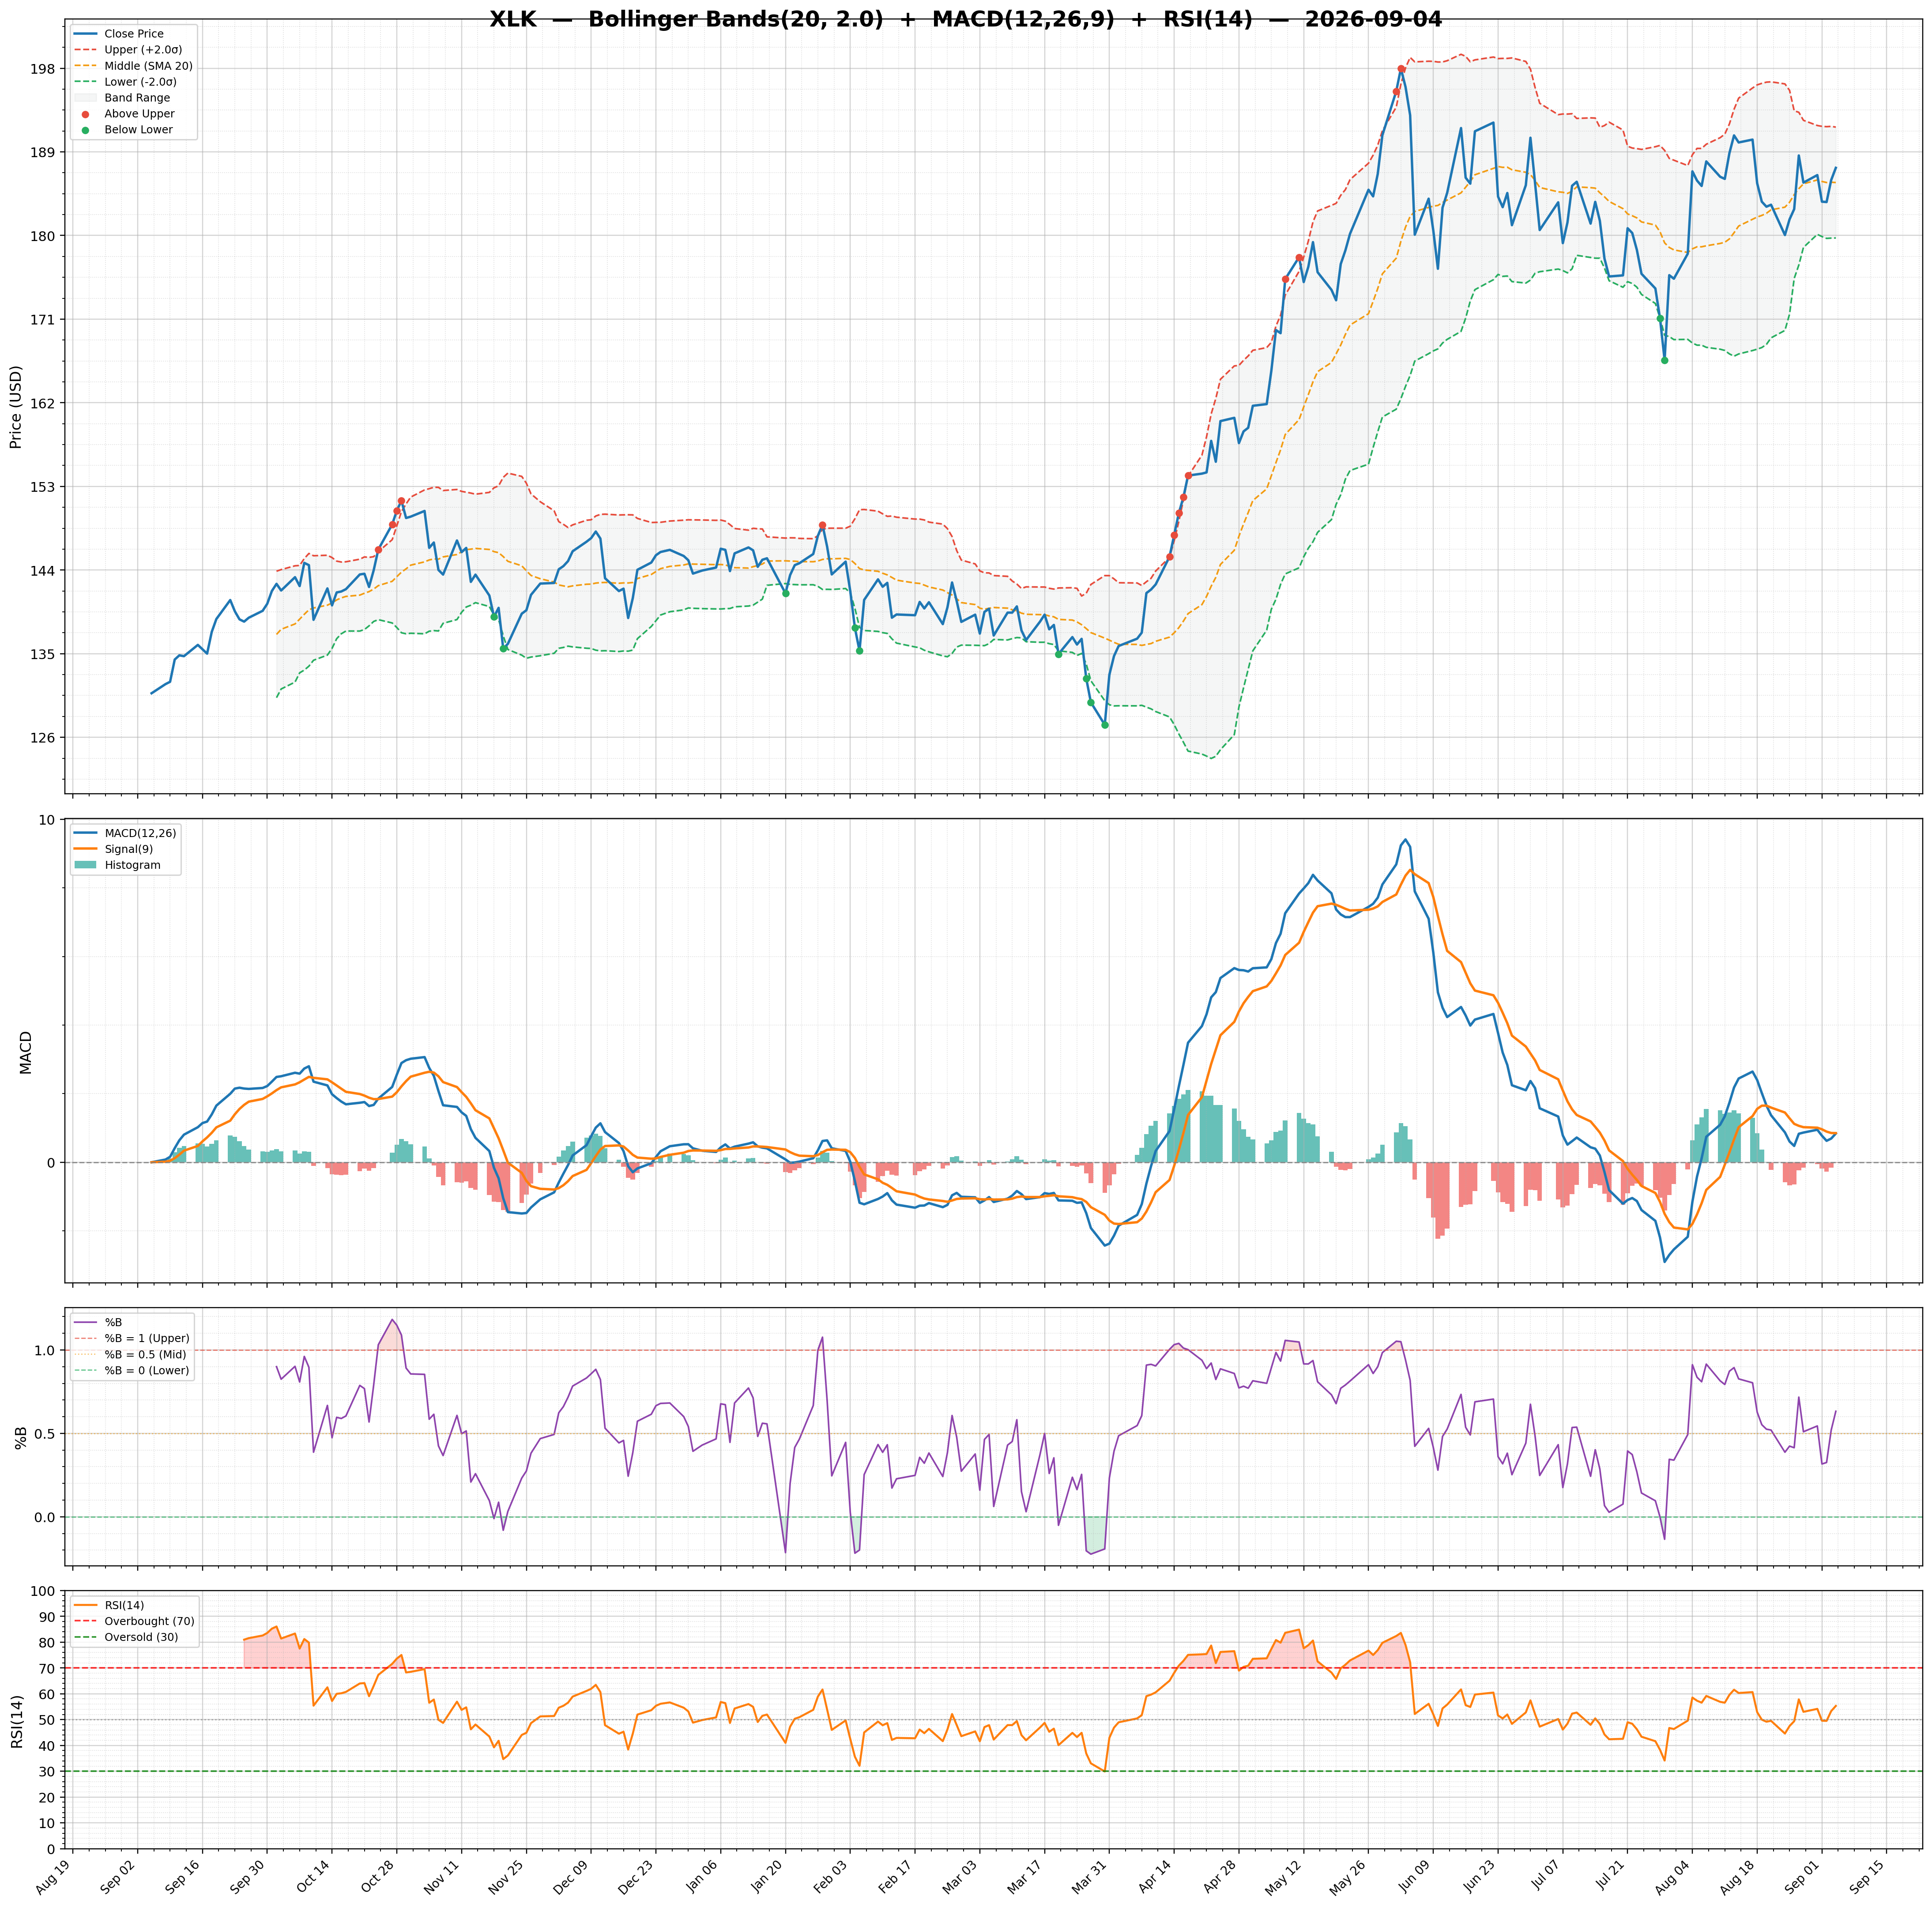
| MACD | -1.49 | Lower Band | 181.55 | Target Low | N/A |
| MACD Signal | 0.38 | Middle Band | 193.88 | Target Median | N/A |
| Histogram | -1.87 | Upper Band | 206.20 | Analysts | N/A |
| Previous Histogram | -1.73 | Bandwidth | 12.720 | Upside | N/A |
| Histogram Trend | Decreasing | %B | 0.03 | ||